Abstract
Nano-spatial distribution of cell surface molecules on cell membrane fluctuations during T-cell activation has not been reported. In this study, we innovated application of near-field scanning optical microscopy (NSOM)/quantum dots (QD)-based nanotechnology through three-dimensional image fusion algorithm to merge the simultaneously-obtained dual-color fluorescence information and three-dimensional topography. This novel imaging system made it possible to visualize nano-spatial distribution and organization of early-activation molecules CD69 and late-activation molecules CD71 on cell-membrane fluctuations during T-cell activation. Interestingly, most CD69 molecules were clustered to form 250–500 nm nano-domains polarizing predominantly in the peak of the cell-membrane fluctuations. In contrast, although CD71 molecules were also clustered as 250–500 nm nano-domains, they polarized dominantly in the valley of the cell-membrane fluctuations. The peak-valley polarities of CD69 nano-domains and CD71 nano-domains implied their different functions. CD69 nano-domains polarizing on membrane-peak fluctuations might serve as transient platforms driving TCR/CD3-induced signaling and activation, whereas CD71 nano-domains distributing in the membrane-valley fluctuations appeared to facilitate iron uptake for increased metabolisms in T-cell activation. Importantly, this NSOM/QD-based fluorescence-topographic image fusion provides a powerful tool to visualize nano-spatial distribution of cell-surface molecules on cell-membrane fluctuations and enable better understanding of distribution-function relationship.
Keywords: Nanoimmunology, Nanobiotechnology, NSOM, T-cell activation, CD69, CD71
Introduction
The activation of T cells involves morphological changes, which include the rearrangement of cell membrane fluctuations relevant to the actin and microtubules cytoskeleton remodeling[1–3], and the induction of expression for some cell surface molecules such as CD69 (a very early activation antigen, usually regarded as the earliest activation cell surface maker on T cell) and CD71 (a late activation antigen, usually named as membrane glycoprotein transferrin receptor(TfR)). These activation markers participate in cell proliferation and correlate with the degree of immune activation[4]. Recent studies have illustrated that T cells can functionally polarize their actin and microtubules cytoskeleton and some cell surface receptors clustering toward antigen-presenting cells(APCs) to facilitate cell signaling, cell motility and protein uptake[1,5–10]. Although some studies suggest that CD69 might control the cross-talk between innate components and lymphocytes, or act as a novel immunoregulatory molecule induced following T cell activation[11,12], molecular mechanisms underlying the action of CD69 are poorly understood. Moreover, it remains unknown about the relationship between CD69 spatial and temporal distribution and CD69 immunoregulatory function. Upon activation, CD71 on T cells is up-regulated as a mechanism to meet the increased iron demands associated with increased metabolism, and meanwhile to act as a housekeeping receptor that binds iron-loaded transferrin at cell surface and trigger internalization[13,14]. However, little is known about how CD71 binds iron-loaded transferrin and mediates endocytosis on cell membrane. We presume that direct visualization of the nano-spatial distribution of CD69 and CD71 on cell-membrane fluctuations during T-cell activation may help to elucidate mechanisms of T-cell activation. But such molecular imaging studies have not been reported.
Various methods have been employed to visualize cell surface in nanoscale resolution by using scanning probe microscopy. Scanning tunneling microscopy(STM) can visualize surface at the highest resolution(~0.1nm), but its application in the field of biological science is difficult due to the complicated sample-preparing. Atomic force microscopy(AFM) is limited for failing to obtain specific fluorescence information for naturally-unknown molecules on cell surface. The traditional laser scanning confocal microscopy(LSCM) do not have a resolution well enough to detect cell-membrane fluctuations and cell surface molecules at nanoscale. In contrast, near-field scanning optical microscopy(NSOM) can stimultaneously visualize topography and fluorescence of cell-surface in nanoscale resolution[15–18], therefore should be the best candidate for imaging of nanoscale distribution of cell surface molecules on cell membrane fluctuations.
Recently, we have innovated the use of NSOM/quantum dots (QD)-based nanotechnology through dipole-polarization detection and dual-color imaging to visualize nanoscale distribution and organization of antigen-specific TCR/CD3, co-receptor CD4 or CD8, as well as nano-spatial relationship between TCR/CD3 and CD4 or CD8. Our novel NSOM/QD-based nanoscale imaging overcomes the outstanding problem of photobleaching conventional immune-fluorochrome[19–21] while executing near-field imaging that breaks through the diffraction limit, and provides highly-reproducible fluorescence imaging with a best optical resolution of ~50 nm. In the current study, we have up-graded the NSOM/QD-based nanotechnology through three-dimensional image fusion algorithm to merge the simultaneously obtained dual-color fluorescence information and three-dimensional topography. This novel imaging approach therefore made it possible to visualize nano-spatial distribution and organization of CD69 and CD71 on the cell membrane fluctuations during T-cells activation.
Results and discussion
NSOM/QD-based fluorescence-topographic fusion revealed that the distribution of CD4 molecules on cell-membrane fluctuations was random in un-stimulated T cells
CD69 is rapidly and transiently expressed on the activated T cells, but not on the resting lymphocytes. As an initial effort to directly visualize nanospatial distribution of CD69 on cell membrane, we first imaged CD4 molecules on cell surface of un-simulated T cells using NSOM/QD-based imaging system. As we recently described[20], most of CD4 molecules were detected as 70–140 nm nano-clusters(≤200nm) equivalent to 2–4 QD dots in fluorescence-intensity and size(FWHM)(Fig. 1A, 1C). Moreover, these fluorescence QD dots were clearly distinct with >40–50 nm distance from each other under the high-resolution NSOM(Fig. 1A, 1C). Since NSOM topographic and fluorescent images can be simultaneously obtained to facilitate visualization of the nano-spatial distribution and organization of cell surface molecules on cell-membrane fluctuations, we innovated the NSOM 3-dimensional fluorescence-topographic fusion image through merging a three-dimensional shaded surface from the height components and fluorescence distribution from the intensity components. This combined signals clearly showed that the distribution of CD4 molecules of un-simulated T cell were random without forming polarity on cell-membrane fluctuations (Fig.1B). However, once T cell were activated, CD4 molecules were clustered to form 250–500nm nano-domains, which were co-localized with TCR/CD3 nano-domains and polarized predominantly in the peak of the cell-membrane fluctuations[20]. According to Dustin group description[10], these TCR/CD3-based nano-domains with peak-polarity might serve as transient platforms for signal initiation of T cells activation, thus facilitate the formation of immunological synapse.
Fig.1. Fluorescence-topographic fusion of NSOM/QD-based imaging revealed that the distribution of CD4 were random without forming nano-domains and polarization on cell-membrane fluctuations of un-stimulated T cells.
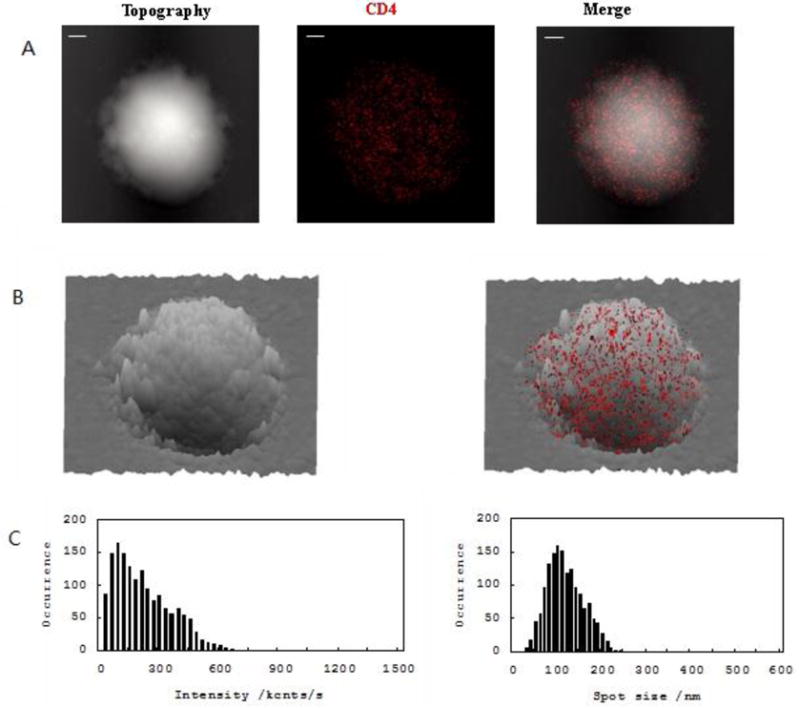
The NSOM/QD-based fluorescence-topographic fusion images of one representative of un-stimulated T cells (A) T cell topography(left), fluorescence image of QD-bound CD4(red, middle), 2-dimensional topography-fluorescence merge image(right).Scale bar 1μm. (B) 3-dimensional image of T cell topography(left), fluorescence-topographic fusion image(right). (C) Histograms of frequency distribution of fluorescence intensity(left) and size(FWHM)(right) of QD-bound CD4 on membrane of T cell. Single or multiple QD-bound CD4 were judged based on the single QD fluorescence intensity and size(FWHM) as previously published as well as polarization detection. Scale bars are indicated in each sub-figure. The integration time for all the images was 30ms with 400× 400 scanning lines. Majority of CD4 were distinctly distribute as nano-clusters(≤200nm) and randomly located on cell-membrane fluctuations without forming polarization.
NSOM/QD-based dual color fluorescence-topographic image fusion revealed that CD69 molecules were clustered to form 250–500 nm nano-domains polarizing predominantly in the peak of the cell-membrane fluctuations during T-cell activation, whereas clustering CD71 nano-domains (250–500 nm), to our surprise, polarized dominantly in the valley of the cell membrane fluctuations
To facilitate evaluation of the expression of CD69 and CD71 in a sustained T-cell activation, we temporally defined degrees of T cells activation based on the CD3/CD28 co-stimulation time: (i) early-phase T-cell activation (stimulation time ≤6 hours); (ii) mid-phase T-cell activation(stimulation time >12 hours but ≤48 hours); (iii) late-phase T-cell activation (stimulation time >72 hours). Confocal microscopy showed that CD69 expression was increased during the time from early-phase to mid-phase activation of CD4+ T cells, while CD71 expression was increased during the time from mid-phase to late-phase activation of CD4+ T cells. We then utilized the NSOM/QD-based fluorescence-topographic fusion imaging system to explore nanoscale distribution of CD69 on cell-membrane fluctuations in early-phase activation of CD4+ T cells in which CD71 was not expressed. Most of detectable CD69 (~65%) were clustered as 250–450 nm nano-domains on cell membrane(Fig. 2A, 2C). Interestingly, more than 80% of these CD69 nano-domains polarized predominantly in the peak of the cell-membrane fluctuations(Fig.2B). This finding suggested that CD69 function correlated with actin cytoskeleton polarization relevant to modulation of the activation of T cells, as actin cytoskeleton remodeling appeared to be essential for the redistribution of cellular receptors and the assembly of signaling complexes, which ultimately results in the formation of immunological synapse[3,22]. Our results also suggested that formation of CD69 nano-domains with peak-polarity might serve as transient platforms driving TCR/CD3-induced signal initiation, and act as immunoregulatory molecules. The CD69 nano-domains in the peak of membrane fluctuations may therefore facilitate the formation of immunological synapse and TCR/CD3-mediated signal transduction.
Fig.2. NSOM/QD-based fluorescence-topographic fusion revealed that CD69 were clustered to form 250–450nm nano-domains, and polarized predominantly in the peak of the cell-membrane fluctuations in early-term activated T cells.
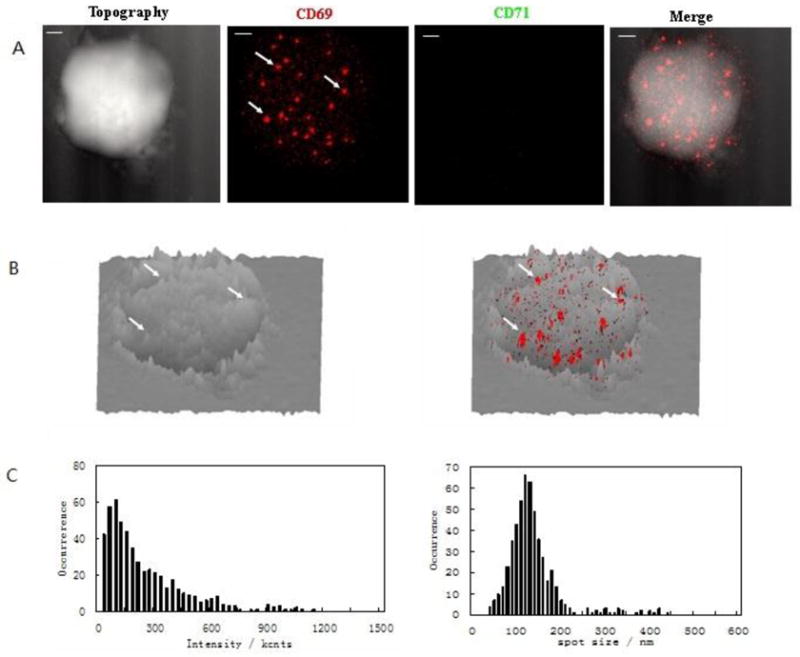
The NSOM/QD-based fluorescence-topographic fusion images of one representative of early activated T cells. (A) T cell topography(left), fluorescence image of QD-bound CD69 (red, middle, no CD71 expression), 2-dimensional topography-fluorescence merge image(right). Scale bar 1μm (B) 3-dimensional image of T cell topography(left), fluorescence-topographic fusion images(right). (C)Histograms of frequency distribution of fluorescence intensity(left) and size(FWHM)(right) of QD-bound CD69 on membrane of T cell. Most of detectable CD69 (~65%) were clustered as 250–450nm nano-domains on cell membrane, furthermore, more than 80% of these nano-domains polarized predominantly in the peak of the cell-membrane fluctuations, as illustrated by white arrows. Note that CD4 nano-domains and polarization were hardly seen in un-stimulated T cells.
Next, we simultaneously imaged the formation of CD69 nano-domains with peak-polarity and nano-spatial distribution of CD71 during a sustained T-cell activation. To do this, we upgraded NSOM/QD-based fluorescence-topographic fusion through dual-color imaging system, which could simultaneously collect two molecules fluorescence of images by a beam splitter in 0° and 90° components. This useful imaging system allowed us to simultaneously visualize CD69 and CD71 in mid-phase and late-phase T-cell activations, respectively. We found apparent increases in the number of CD69 molecules as well as the number, size and density of CD69 nano-domains during the mid-phase T-cell activation when compared with those in early-phase activation (Fig.3A, 3C1, Fig. 4A, 4B). Most of these CD69 nano-domains(~80%) were still polarized predominantly in the peak of the cell-membrane fluctuations(Fig.3B1, 3B2), indicating that formation of CD69 nano-domains with peak-polarity was still taking place in a sustained T cell activation. On the other hand, CD71 molecules were expressed during the mid-phase T-cell activation, and most of CD71(~60%) were also clustered to form 250–350nm nano-domains (Fig.3A, 3C2). With the progression from mid-phase to late-phase T-cell activation, we found significant increases in the number of CD71 as well as the number, size and density of CD71 nano-domains (Fig.4A,4B, Fig.5A,5C,). These CD71 nano-domains did not co-localize with that of CD69 on cell membrane(Fig.3A) and, to our surprise, polarized predominantly in the valley of the cell-membrane fluctuations(~80%) (Fig.3B1, 3B2, 5B). It has been reported that the cell-membrane navigates to form a vesicle and thus enhance iron uptake and T cell survival [13]. Now, we demonstrated that about 50~200 QD-bound CD71 molecules formed a 250–500 nm nano-domain, which might be relevant to a vesicle on cell surface. These CD71 nano-domains might mediate endocytosis for active iron uptake. Thus, peak-valley polarities of CD69 and CD71 may implicate their different biological activities, both required for a sustained T-cell activation.
Fig.3. NSOM/QD-based fluorescence-topographic fusion revealed that CD69 were still clustered to form 250–500nm nano-domains, and polarized predominantly in the peak of the cell-membrane fluctuations in medium-term activated T cells, while CD71 were also clustered to form 250–350 nm nano-domains, however polarized predominantly in the valley of the cell membrane fluctuations.
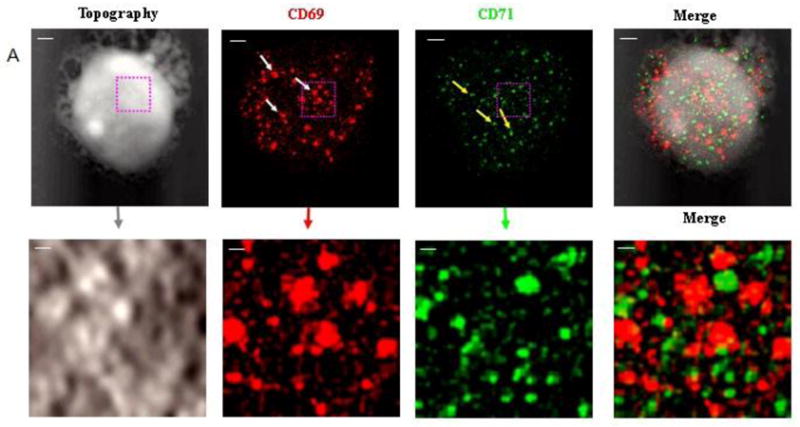
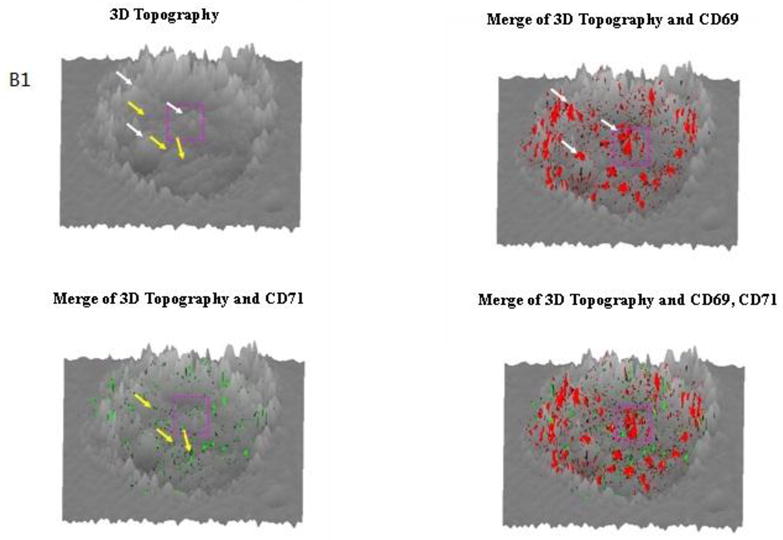
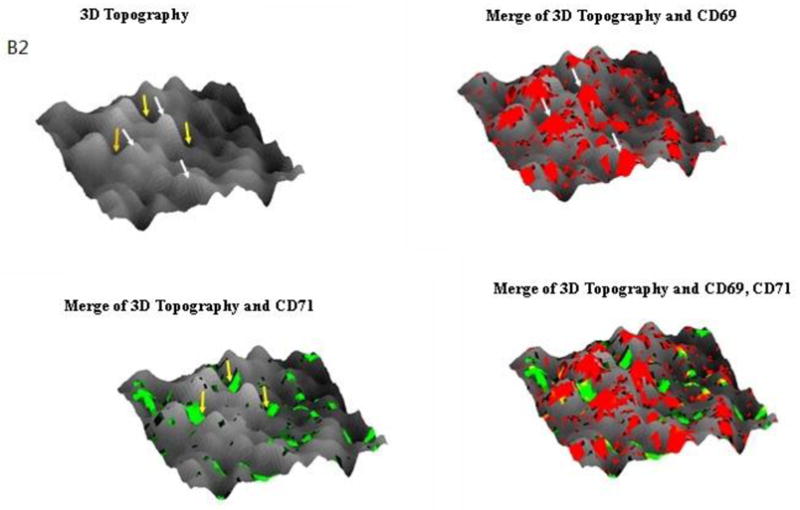
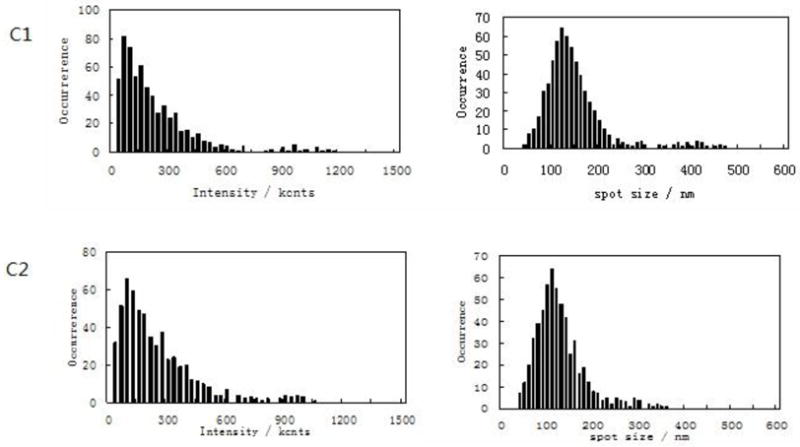
The NSOM/QD-based dual color fluorescence-topographic fusion images of one representative of medium-term activated T cells. (A) Upper panels showed T cell topography(left), fluorescence images of QD-bound CD69 and CD71 ( red and green respectively, middle), 2-dimensional topography-fluorescence merge image(right). Scale bar 1μm Lower panels show zoom image of the areas as indicated by the squares on the top panels. Scale bar 200nm (B1) Upper panels showed 3-dimensional images of T cell topography(left), CD69 fluorescence-topographic fusion images(right); Lower panels showed CD71 fluorescence-topographic fusion images(left), dual color of CD69 and CD71 fluorescence-topographic fusion image(right); (B2)Upper panels showed zoom image of the areas as indicated by the squares on the upper panels of B1. Lower panels showed zoom image of the areas as indicated by the squares on the lower panels of B1. (C1)Histograms of frequency distribution of fluorescence intensity(left) and size(FWHM)(right) of QD-bound CD69 on membrane of T cell; (C2) Histograms of frequency distribution of fluorescence intensity(left) and size(FWHM)(right) of QD-bound CD71 on membrane of T cell. Compared to early activated T cells, a sustained stimulation led to remarkably increase in molecules numbers of CD69 expression as well as in the numbers, size and density of CD69 nano-domians of medium-term activated T cells, about 75% of CD69 were still clustered to form 250–500nm nano-domains, and polarized predominantly in the peak of the cell-membrane fluctuations, as illustrated by white arrows. Meanwhile CD71 (green) can be detected and most of them clustered as 250–350 nm nano-domains on cell membrane, however, these CD71 nano-domains did not colocalize with that of CD69 on cell membrane, but polarized predominantly in the valley of the cell-membrane fluctuations, as illustrated by yellow arrows.
Fig.4. A sustained T cells stimulation enhance to form CD69 nano-domains with peak- polarity or CD71 nano-domains with valley-polarity in number and molecule density on the cell membrane fluctuations.
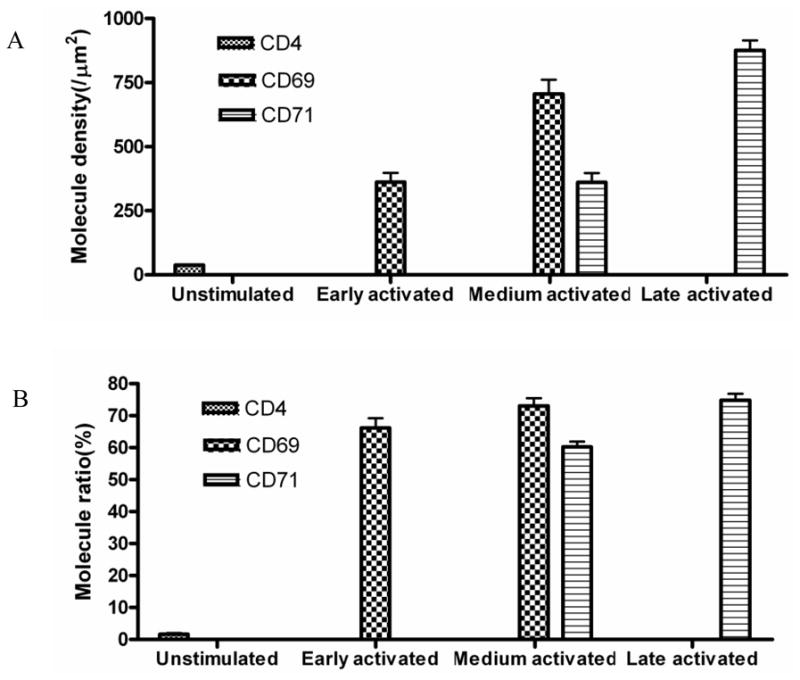
(A) Molecular-density analysis showed the molecular density of CD4 molecules on the membrane of un-stimulated T cells, molecular density of CD69 or CD71 molecules of early-term, medium-term, late-term activated T cells. Activated T cells exhibited significantly greater molecule density of CD69 or CD71 nano-domains compared to molecular density of CD4 of unstimulated T cells(p<0.05); A sustained stimulation significantly increases density of CD69 nano-domains of medium-term activated T cells compared to early-term activated T cells(p<0.05). Similarly, A sustained stimulation significantly increases molecule density of CD71 nano-domains of late-term activated T cells compared to medium-term activated T cells(p<0.05). Up to 10 cells were analyzed. (B)The percentage numbers of CD69 or CD71 molecules that arrayed to form nano-domains significantly increases in medium-term or late-term activated T cells compared to early-term or medium-term activated T cells(p<0.05). Up to 10 cells were analyzed.
Fig.5. NSOM/QD-based fluorescence-topographic fusion revealed that CD71 were still clustered to form 250–500 nm nano-domains and polarized predominantly in the valley of the cell membrane fluctuations in late-medium activated T cells.
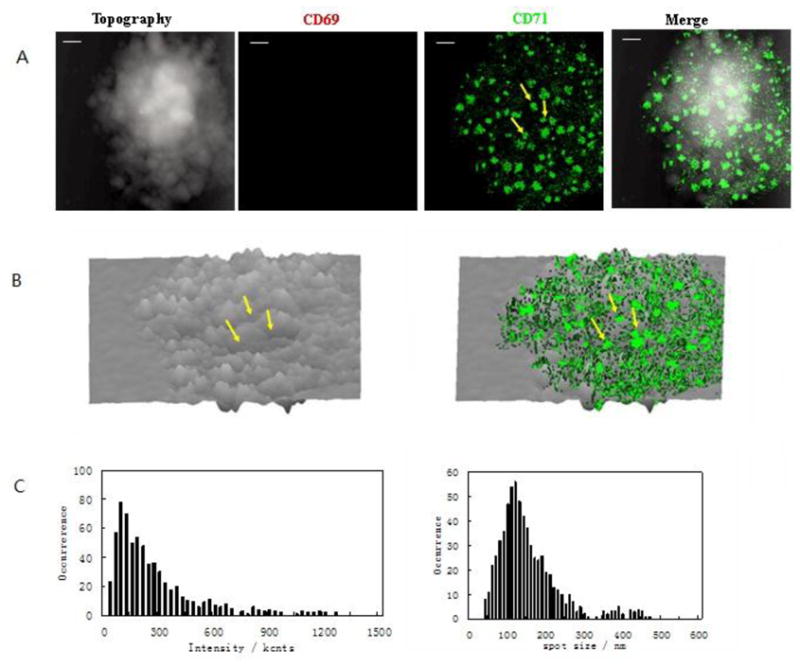
The NSOM/QD-based dual color fluorescence-topographic fusion images of one representative of late-term activated T cells. (A) T cell topography(left), fluorescence images of QD-bound CD71 (green, middle, no CD69 expression), 2-dimensional topography-fluorescence merge image(right). Scale bar 1μm (B) 3-dimensional images of T cell topography(left), fluorescence-topographic fusion images(right). (C)Histograms of frequency distribution of fluorescence intensity(left side) and size(FWHM)(right side) of QD-bound CD71 on membrane of T cell. Compared to medium activated T cells, a sustained stimulation led to remarkably increase in molecules numbers of CD71 expression as well as in the numbers, size and density of CD71 nano-domians of late-term activated T cells, more than 60% of CD71 were still clustered to form 250–500nm nano-domains, and polarized predominantly(~80%) in the peak of the cell-membrane fluctuations, as illustrated by yellow arrows.
Collectively, for the first time, our NSOM/QD-based fluorescence-topographic fusion imaging system made it possible to directly image the exact distribution of cell surface molecules on cell-membrane fluctuations during T-cell activation. The formation of CD69 nano-domains with peak-polarity might serve as transient platforms for TCR/CD3-induced signal initiation, facilitate a sustained T cells activation, and therefore act as immunoregulatory molecules. Moreover, CD69 nanodomains with peak-polarity should be relevant to the actin cytoskeletal system remodeling, and thus facilitate the formation of immunological synapse and TCR/CD3-mediated signal transduction. On the other hand, formation of CD71 nano-domains with valley-polarity might play an important role in binding iron-loaded transferrin on cell surface, triggering internalization, thus facilitating iron uptake and maintaining full T-cell activation. Our nano-spatial findings may provide new insights into the cells surface molecules with cytoskeletal system remodeling or iron uptake in T-cell activation. Importantly, this NSOM/QD-based fluorescence-topographic image fusion appears to be a powerful tool to visualize the nano-spatial distribution of cell surface molecules on cell-membrane fluctuations and therefore enable better understanding of distribution-function relationship.
Materials and methods
Blood and reagents
Three healthy uninfected Rhesus(Macaca malutum) macaques, 4 to 8 years old, (3–5kg weight) served as blood donors. The animal use was approved by UIC IACUC. Anti-CD3-coated 96-well plates were from BD Biosciences. RPMI-1640 culture medium was obtained from GibcoBRL Corp. Biotinylated anti-human CD4, Biotinylated anti-human CD69, mouse anti-human CD71 and mouse anti-human CD28 antibodies were purchased from BD Pharmagin. FITC-conjugated anti-human CD71 Ab was from BD Bioscience. Anti-mouse IgG (H+L)-conjugated quantum dot (QD) 605, streptavidin-conjugated QD 655 and goat anti-mouse IgG (H+L) conjugated Cy3 were from Invitrogen. QDs were centrifuged and filtered as previously described to remove aggregates of QDs[19,21]. All these antibodies and QDs have been validated for use at our UIC lab[19,20,23].
Lymphocyte isolation, T-cell stimulation, and immune staining
Peripheral blood was collected from Rhesus monkeys as described above. Peripheral blood mononuclear cells (PBMC) were separated by Ficoll-Hypaque gradient centrifugation and washed with phosphate-buffered saline (PBS) as described by the previous reports from our UIC lab[23]. For the anti-CD3/anti-CD28 Ab co-stimulation, PBMC at a cell density of 2×10⁵ cells /ml were seeded onto anti-CD3 Ab-coated 96-well plates and co-cultured with 5 ng/ml anti-CD28 Ab for respectively 6, 12, 48, 72 hours in RPMI 1640 containing 10% FBS at 37°C in a 5% CO2 atmosphere.
For T-cell immune-labeling, 2% formalin/PBS solution was first used to fix T cells for 20 min to rule out the possibility of non-specific activation of T cells which induced by antibody labeling. For NSOM imaging, in the first color labeling, Biotinylated anti-human CD69(or CD4) antibody were used to label CD69(or CD4) molecules, followed by QD streptavidin conjugated 655, in the second color labeling, mouse anti-human CD71 was used to label CD71, followed by anti-mouse QD IgG (H+L) conjugated 605. For confocal imaging, in the first color labeling, mouse anti-human CD4 was used to label CD4, followed by goat anti-mouse IgG (H+L) conjugated Cy3, in the second color labeling, biotinylated anti-human CD69 antibody was used to label CD69 molecules, followed by QD streptavidin conjugated 655, in the third color labeling, mouse anti-human CD71 conjugated FITC was used to label CD71. Finally, 2% formalin/PBS solution was used again to further fix the cells. For each labeling step, FBS/PBS was applied to wash twice to remove any unbound antibody or QDs. For NSOM imaging study, dd water suspensions of cells were spread onto glass cover slides that were pretreated with poly-L-lysine (Sigma) and air-dried at room temperature for NSOM imaging. Non-specific staining was not seen under the NSOM for the control using isotype control antibody followed by immune-conjugated QD or QD alone, as described previously[19]. Ab-or streptavidin-conjugated QD appear to have sizes of 25nm[19]. (CD4, CD69, CD71 may have nano-spatial sizes of ~1–5 nm).
NSOM imaging
An Aurora-3 NSOM system (Veeco) was used in this study. The system was shown schematically in our pervious study[21]. The continuous wave semiconductor laser (Coherent, USA; Cube, 404 nm) was launched into a single mode optical fiber (Thorlabs Inc, USA) and used as excitation source. Straight, aluminum -coated probe (Veeco) with an aperture diameter of 50–80 nm was used for imaging. It should be noted that no significant difference in full width at the half maximum (FWHM) of fluorescent spots when we used different probes[19,21]. The probe tip was attached to piezoelectric quartz tuning fork (resonance frequency ~93 KHz), and probe-sample distance was maintained constant of 10 nanometers by tuning-fork-based shear-force feedback. This mode of operation provided simultaneous topographic and optical data, which was collected with a 40×, NA 0.65 objective (Olympus, Japan) and split into two beams by a cube beamsplitter (Newports Inc. USA), then detected by two APDs (PerkinElmer, Canada) in 0° and 90°, respectively. Optical filters 655±10 nm and 605±10 nm (Newports Inc. USA) were used to separate the fluorescence from the excitation light and the background. The samples were mounted onto the XY stage with full scanning range of 30μm×30μm, and a video camera was used to locate the regions of interested. The images were stable and reproducible during repeated scanning. In this study, the laser excitation intensity was 120 W/cm2, the images consisted of 400×400 measured points, and most images have been slightly low-pass filtered.
Image processing, data analyses and statistics
SPMLab 6.02 software (Veeco) was used to obtain high quality NSOM fluorescence image and topographic image by leveling and convolution. Mathlab7.0 were used to the following image processing and analyses. Firstly, two fluorescence images denoted two labeled molecules(CD69 and CD71) and acquired simultaneously from NSOM were color-coded in red and green respectively, and then the 2-dimensional merged image of two color fluorescence images and topographic image was obtained by the intensity superposition algorithm of point to point. In order to visually display the fluorescent spots on cell-membrane fluctuations, Surf function, which can create a three-dimensional shaded surface from the height components, was used to show the 3-dimensional fluorescence-topographic fusion image for the above 2-dimensional merged image. Mathlab7.0 were also used to calculate the fluorescence intensity and measure FWHM distribution of fluorescent spots. The number of QD molecules in each fluorescence spot was estimated based on the fluorescence intensity of single QD (see below), whereas the intensity of each spot was determined by adding all photon counts with a contour of 15% of the peak intensity. For the molecular density determination, the fluorescence intensity of fluorescent spots was analyzed to determine the average fluorescence signal representing the average QD numbers. At the excitation laser intensity of 120 W/μm2, a typical count rate for individual QD 655 and QD605 were 7,000counts/second and 4,500counts/second, respectively (these values were reproducible in repeat experiments). And then the QD numbers were used to correlate the molecule numbers based on the conservative assumption that the QD: secondary Ab: primary Ab: target molecule=1:1:1:1[19,21]. And then the molecular density was determined by dividing the molecule numbers over the nano-domains areas. Student t-test was used to calculate the p-value, as described previously[21], to determine the statistical difference of molecular density or the percentages of molecules that localized into nano- or micro- domains after different stimulations. The quantization approach of the CD69 nano-domains that polarize in the peaks and CD71 nano-domains that polarize in the valleys as following: The quantization parameter is defined as the ratio of the number of CD69 nano-domains with peak-polarity to the total number of CD69 nano-domains on the cell-membrane, and the ratio of the number of CD71 nano-domains with valley-polarity to the total number of CD71 nano-domains on the cell-membrane.
Research Highlights.
NSOM/QD based fluorescence-topographic image fusion system;
Direct visualization the nanoscale distribution of cell surface molecules on cell membrane fluctuations;
Most of CD69 were clustered as nano-domain and polarized in the peak of the cell-membrane fluctuations;
Most of CD71 were clustered as nano-domain and polarized in the valley of the cell-membrane fluctuations;
Acknowledgments
The work was conducted at the Chen Lab in University of Illinois, and authors thank other members in the Chen lab for technical assistance. This work was supported by the National Institutes of Health R01 grants: HL64560 (to ZWC), RR13601 (to ZWC) and the National Nature Science Foundation of China grants: 60978065 and 61078064 (to LZ)
Abbreviations
- NSOM
Near-field Scanning Microscopy
- QD
Quantum Dot
- TCR
T Cell Receptor
Footnotes
Publisher's Disclaimer: This is a PDF file of an unedited manuscript that has been accepted for publication. As a service to our customers we are providing this early version of the manuscript. The manuscript will undergo copyediting, typesetting, and review of the resulting proof before it is published in its final citable form. Please note that during the production process errors may be discovered which could affect the content, and all legal disclaimers that apply to the journal pertain.
References
- 1.Billadeau DD, Nolz JC, Gomez TS. Regulation of T-cell activation by the cytoskeleton. Nat Rev Immunol. 2007;7:131–143. doi: 10.1038/nri2021. [DOI] [PubMed] [Google Scholar]
- 2.Tooley AJ, Gilden J, Jacobelli J, Beemiller P, Trimble WS, Kinoshita M, Krummel MF. Amoeboid T lymphocytes require the septin cytoskeleton for cortical integrity and persistent motility. Nat Cell Biol. 2009;11:17–26. doi: 10.1038/ncb1808. [DOI] [PMC free article] [PubMed] [Google Scholar]
- 3.Lasserre R, Alcover A. Cytoskeletal cross-talk in the control of T cell antigen receptor signaling. FEBS Lett. 2010;584:4845–4850. doi: 10.1016/j.febslet.2010.09.001. [DOI] [PubMed] [Google Scholar]
- 4.Reddy M, Eirikis E, Davis C, Davis HM, Prabhakar U. Comparative analysis of lymphocyte activation marker expression and cytokine secretion profile in stimulated human peripheral blood mononuclear cell cultures: an in vitro model to monitor cellular immune function. J Immunol Methods. 2004;293:127–142. doi: 10.1016/j.jim.2004.07.006. [DOI] [PubMed] [Google Scholar]
- 5.Manz BN, Groves JT. Spatial organization and signal transduction at intercellular junctions. Nat Rev Mol Cell Biol. 2011;11:342–352. doi: 10.1038/nrm2883. [DOI] [PMC free article] [PubMed] [Google Scholar]
- 6.van der Merwe PA, Dushek O. Mechanisms for T cell receptor triggering. Nat Rev Immunol. 2011;11:47–55. doi: 10.1038/nri2887. [DOI] [PubMed] [Google Scholar]
- 7.Balagopalan L, Sherman E, Barr VA, Samelson LE. Imaging techniques for assaying lymphocyte activation in action. Nat Rev Immunol. 2011;11:21–33. doi: 10.1038/nri2903. [DOI] [PMC free article] [PubMed] [Google Scholar]
- 8.Wilkinson B, Downey JS, Rudd CE. T-cell signalling and immune system disorders. Expert Rev Mol Med. 2005;7:1–29. doi: 10.1017/S1462399405010264. [DOI] [PubMed] [Google Scholar]
- 9.Dustin ML, Long EO. Cytotoxic immunological synapses. Immunol Rev. 2010;235:24–34. doi: 10.1111/j.0105-2896.2010.00904.x. [DOI] [PMC free article] [PubMed] [Google Scholar]
- 10.Fooksman DR, Vardhana S, Vasiliver-Shamis G, Liese J, Blair DA, Waite J, Sacristan C, Victora GD, Zanin-Zhorov A, Dustin ML. Functional anatomy of T cell activation and synapse formation. Annu Rev Immunol. 2010;28:79–105. doi: 10.1146/annurev-immunol-030409-101308. [DOI] [PMC free article] [PubMed] [Google Scholar]
- 11.Sancho D, Gomez M, Sanchez-Madrid F. CD69 is an immunoregulatory molecule induced following activation. Trends Immunol. 2005;26:136–140. doi: 10.1016/j.it.2004.12.006. [DOI] [PubMed] [Google Scholar]
- 12.Vega-Ramos J, Alari-Pahissa E, Valle JD, Carrasco-Marin E, Esplugues E, Borras M, Martinez AC, Lauzurica P. CD69 limits early inflammatory diseases associated with immune response to Listeria monocytogenes infection. Immunol Cell Biol. 2010;88:707–715. doi: 10.1038/icb.2010.62. [DOI] [PubMed] [Google Scholar]
- 13.Batista A, Millan J, Mittelbrunn M, Sanchez-Madrid F, Alonso MA. Recruitment of transferrin receptor to immunological synapse in response to TCR engagement. J Immunol. 2004;172:6709–6714. doi: 10.4049/jimmunol.172.11.6709. [DOI] [PubMed] [Google Scholar]
- 14.Artac H, Coskun M, Karadogan I, Yegin O, Yesilipek A. Transferrin receptor in proliferation of T lymphocytes in infants with iron deficiency. Int J Lab Hematol. 2007;29:310–315. doi: 10.1111/j.1365-2257.2006.00848.x. [DOI] [PubMed] [Google Scholar]
- 15.Manzo C, van Zanten TS, Garcia-Parajo MF. Nanoscale fluorescence correlation spectroscopy on intact living cell membranes with NSOM probes. Biophys J. 2011;100:L8–10. doi: 10.1016/j.bpj.2010.12.3690. [DOI] [PMC free article] [PubMed] [Google Scholar]
- 16.van Zanten TS, Cambi A, Koopman M, Joosten B, Figdor CG, Garcia-Parajo MF. Hotspots of GPI-anchored proteins and integrin nanoclusters function as nucleation sites for cell adhesion. Proc Natl Acad Sci U S A. 2009;106:18557–18562. doi: 10.1073/pnas.0905217106. [DOI] [PMC free article] [PubMed] [Google Scholar]
- 17.Herrmann M, Neuberth N, Wissler J, Perez J, Gradl D, Naber A. Near-field optical study of protein transport kinetics at a single nuclear pore. Nano Lett. 2009;9:3330–3336. doi: 10.1021/nl901598z. [DOI] [PubMed] [Google Scholar]
- 18.de Bakker BI, Bodnar A, van Dijk EM, Vamosi G, Damjanovich S, Waldmann TA, van Hulst NF, Jenei A, Garcia-Parajo MF. Nanometer-scale organization of the alpha subunits of the receptors for IL2 and IL15 in human T lymphoma cells. J Cell Sci. 2008;121:627–633. doi: 10.1242/jcs.019513. [DOI] [PubMed] [Google Scholar]
- 19.Chen Y, Shao L, Ali Z, Cai J, Chen ZW. NSOM/QD-based nanoscale immunofluorescence imaging of antigen-specific T-cell receptor responses during an in vivo clonal V{gamma}2V{delta}2 T-cell expansion. Blood. 2008;111:4220–4232. doi: 10.1182/blood-2007-07-101691. [DOI] [PMC free article] [PubMed] [Google Scholar]
- 20.Zhong L, Zeng G, Lu X, Wang RC, Gong G, Yan L, Huang D, Chen ZW. NSOM/QD-based direct visualization of CD3-induced and CD28-enhanced nanospatial coclustering of TCR and coreceptor in nanodomains in T cell activation. PLoS One. 2009;4:e5945. doi: 10.1371/journal.pone.0005945. [DOI] [PMC free article] [PubMed] [Google Scholar]
- 21.Zeng G, Chen J, Zhong L, Wang R, Jiang L, Cai J, Yan L, Huang D, Chen CY, Chen ZW. NSOM- and AFM-based nanotechnology elucidates nano-structural and atomic-force features of a Y. pestis V immunogen-containing particle vaccine capable of eliciting robust response. Proteomics. 2009;9:1538–1547. doi: 10.1002/pmic.200800528. [DOI] [PMC free article] [PubMed] [Google Scholar]
- 22.Tskvitaria-Fuller I, Rozelle AL, Yin HL, Wulfing C. Regulation of sustained actin dynamics by the TCR and costimulation as a mechanism of receptor localization. J Immunol. 2003;171:2287–2295. doi: 10.4049/jimmunol.171.5.2287. [DOI] [PubMed] [Google Scholar]
- 23.Chen CY, Huang D, Wang RC, Shen L, Zeng G, Yao S, Shen Y, Halliday L, Fortman J, McAllister M, Estep J, Hunt R, Vasconcelos D, Du G, Porcelli SA, Larsen MH, Jacobs WR, Jr, Haynes BF, Letvin NL, Chen ZW. A critical role for CD8 T cells in a nonhuman primate model of tuberculosis. PLoS Pathog. 2009;5:e1000392. doi: 10.1371/journal.ppat.1000392. [DOI] [PMC free article] [PubMed] [Google Scholar]


