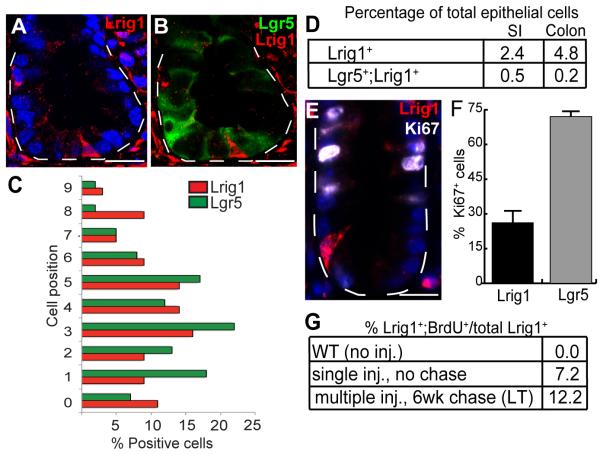
Figure 3. Expression patterns of Lrig1 and Lgr5 in adult mouse colon by immunofluorescence and FACS.
(A-B) Immunofluorescent detection and confocal microscopy of cross-sections in Lgr5-EGFP-IRES-CreERT2 mouse colon detected a subset of Lrig1+ cells (red) present at the crypt base, distinct from Lgr5+ cells (green). (C) Relative position of Lrig1+ and Lgr5+ populations by immunofluorescence for Lrig1 and direct EGFP fluorescence of the Lgr5 reporter. (D) FACS analysis of Lgr5-EGFP-IRES-CreERT2 mouse intestinal epithelial cells (n=9); Lrig1 was detected in 2.4% of total enterocytes and 4.8% of total colonocytes. Using EGFPhi as a marker of Lgr5 expression, 0.5% of total enterocytes and 0.2% of total colonocytes were Lgr5+;Lrig1+. (E) A representative colonic crypt stained for Lrig1 (red) and Ki67 (white). (F) Twenty-five percent of Lrig1+ cells also stained with Ki67, whereas 75% of the Lgr5+ population also stained with Ki67. (G) BrdU incorporation, measured in Lrig1 mouse colonocytes by FACS. Lrig1+;BrdU+ cells were not detected in uninjected mice; 7% of Lrig1+ colonocytes co-expressed BrdU 2 hours after injection (n=3). Mice injected daily for five days and examined six weeks later, had 12% Lrig1+;BrdU+ colonocytes (n=3). “LT” indicates long-term, label-retaining experiment. Scale bars represent 25μm (A-B, E). Error bars represent s.e.m. See also Figure S3-S4.

