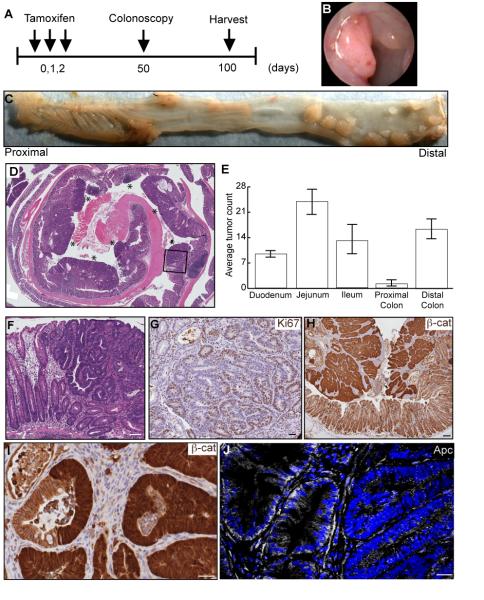
Figure 6. Lrig1-CreERT2/+;Apcflox/+ mice develop colonic tumors.
(A) Schematic depiction of experimental design. Mice were injected with tamoxifen daily for three days, monitored by colonoscopy starting at day 50 and sacrificed 100 days post-tamoxifen induction. (B-C) Examination of mice three months post-induction revealed the mice developed distal colonic tumors (shown by colonoscopy in B and by whole mount in C). (D) H&E staining of a tissue cross-section from a representative colon. Individual tumors are indicated by the asterisks. (E) Distribution and multiplicity of tumors from seven mice with the greatest number of adenomas formed in the jejunum. (F) High-grade dysplasia was present within a large tumor (black box in D). (G-I) Immunohistochemical examination of colonic tumors for Ki67 expression (brown in G), nuclear and cytosolic β-catenin (brown in H), and high-power image of a gland that contains both cytosolic- and membrane-associated β-catenin (I). (J) Immunofluorescent examination of colonic tumors for Apc expression (white); Apc expression is heterogeneous. Scale bars represent 50μm in F, 25μm in G, I and J and 75μm in H. Error bars represent s.e.m. See also Figure S6.

