Figure 4.

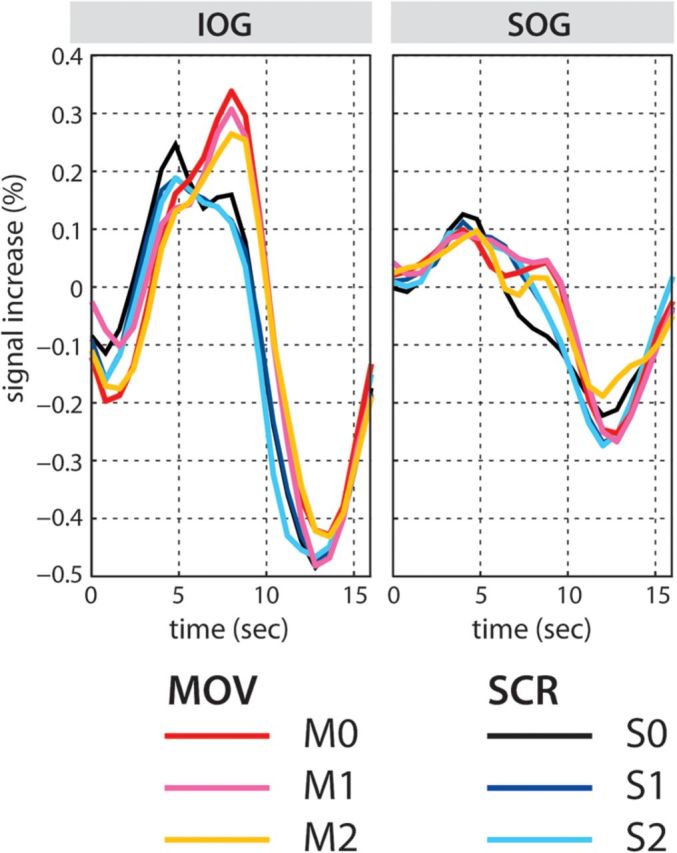
TTC plots for the activated regions revealed by the main effect of TYPE In the IOG and SOG. The TTCs for MOV conditions show later peaks compared to those for SCR conditions.

TTC plots for the activated regions revealed by the main effect of TYPE In the IOG and SOG. The TTCs for MOV conditions show later peaks compared to those for SCR conditions.