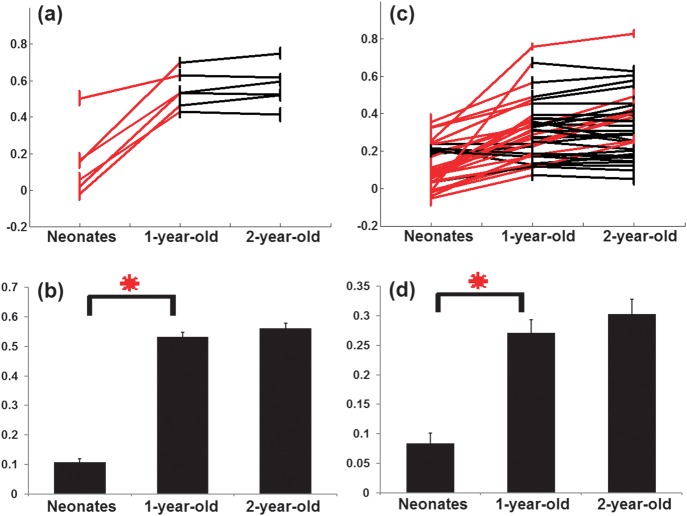
Figure 2.
The temporal characteristics of functional connection strengths within the dorsal attention and default networks. (a) Growth trajectories of the individual functional connections in the dorsal attention network. Red lines indicate significant increase (P < 0.05, FDR corrected), while black lines represent nonsignificant changes; (b) the mean network connection strength in neonates, 1 year, and 2 years old for the dorsal attention network (red asterisk, P = 3.9 × 10⁻⁷); (c) growth trajectories of the individual functional connections in the default network with an identical arrangement as that in (a); (d) the mean network connection strength in neonates, 1 year, and 2 years old for the default network (red asterisk, P = 4.5 × 10⁻⁶). All whiskers represent standard error of the mean.

