
Figure 4.
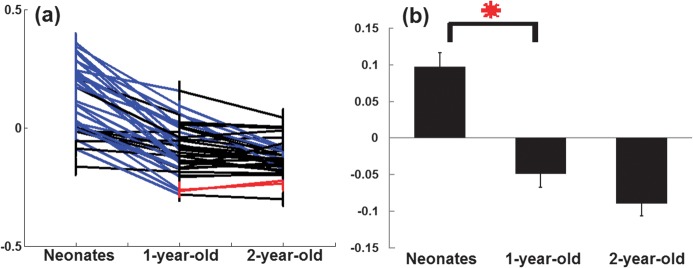
The temporal characteristics of functional connection strengths of the interaction between the dorsal attention and default networks. (a) Growth trajectories of individual between-network connections. Red/blue colors indicate significant (P < 0.05, FDR corrected) increase/decrease of interaction strength, respectively, while black color represents nonsignificant changes; (b) changes of mean interaction strength (red asterisk represents statistically significant change (P < 0.05, FDR corrected)). All whiskers represent standard error of the mean.