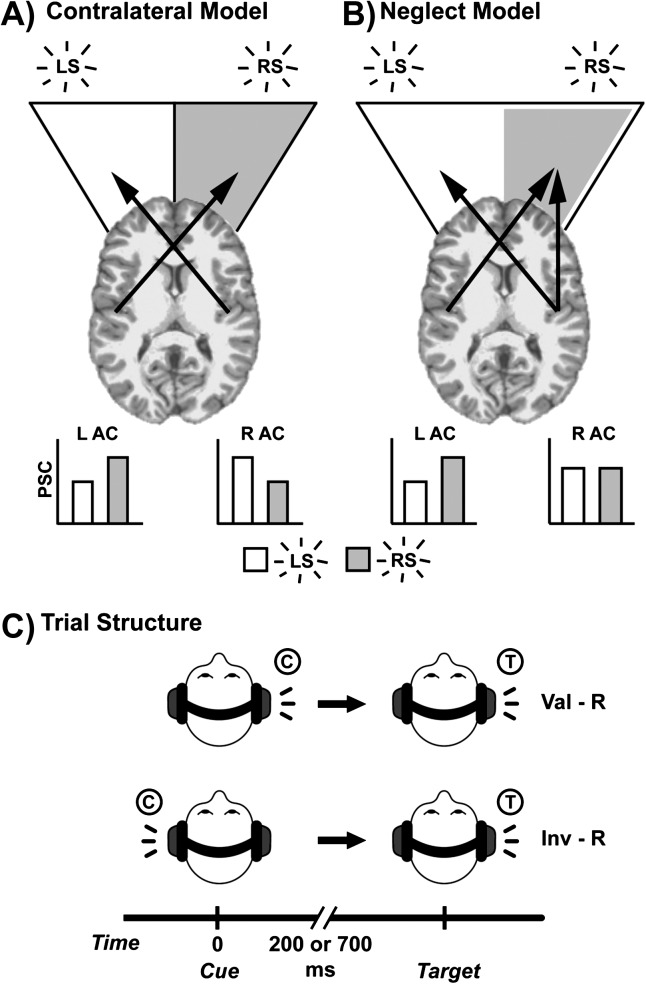
Figure 1.
This figure presents predictions and cartoon illustrations of the contralateral (Panel A) and neglect (Panel B) models of response to lateralized auditory stimuli. In the contralateral model, both left and right hemispheres display a bias (arrows) toward stimuli in the contralateral hemifield. Bar graphs indicate hypothesized greater activation (PSC, percent signal change) to contralateral stimuli (LS, left stimulus; RS, right stimulus) within each AC (L AC, left auditory cortex; R AC, right auditory cortex). In the neglect model, the L AC shows a bias toward stimuli in the right hemifield (gray area), while the R AC responds more equally to stimuli in both hemifields (white area). Panel C presents the trial structure for sample valid (Val-R) and invalid right (Inv-R) trials. For valid trials, cue (C) and target (T) occur in same headphone/hemifield; for invalid trials, targets occur in opposite headphones/hemifields.

