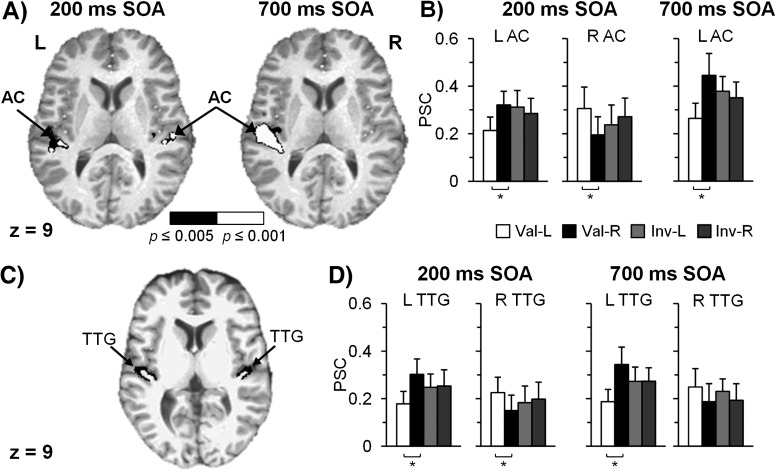
Figure 2.
Panel A displays regions demonstrating Laterality × Validity interaction effects for 200 and 700 ms SOA in the left and right figures, respectively. Clusters of significant activation were present in the AC bilaterally at 200 ms SOA and in the left AC only at 700 ms SOA. Color scale indicates voxel-level significance (black, P < 0.005; white, P < 0.001). Panel B presents mean PSC for valid left (Val-L, white), valid right (Val-R, black), invalid left (Inv-L, light gray), and invalid right (Inv-R, dark gray) conditions for clusters within the AC. Panel C displays a sample of automatic parcellation (black areas) of the transverse temporal gyrus (TTG) in one subject, whereas Panel D presents mean group PSC within the TTG for the 4 trial conditions. Slices are located at 9 mm superior to the origin in Talairach space. All error bars represent 2 × standard error of the mean. Bracketed asterisks indicate significant findings (P < 0.05).

