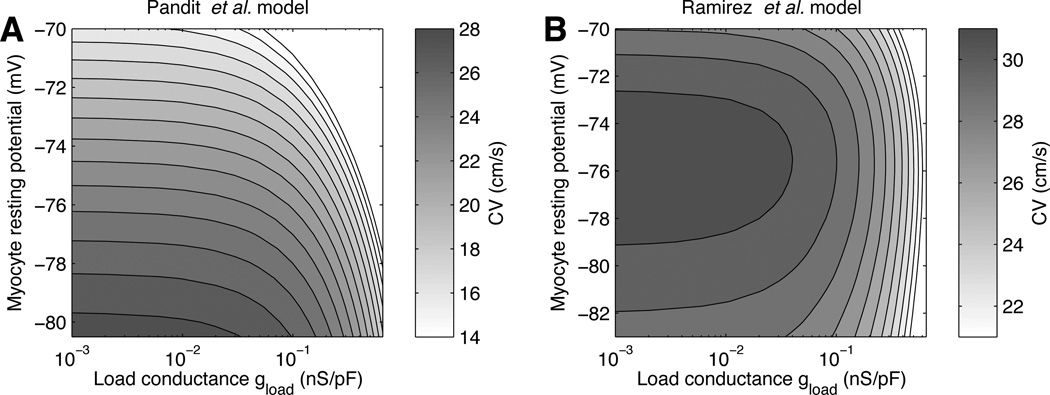
Figure 3.
Conduction velocity (CV) for different myocyte resting potentials Vm and load conductances gload, as computed using the Pandit et al. (A) and the Ramirez et al. (B) myocyte membrane models. The vertical axis ranges from the myocyte intrinsic resting potential to −70 mV. The step size between isolines is 1 cm/s.

