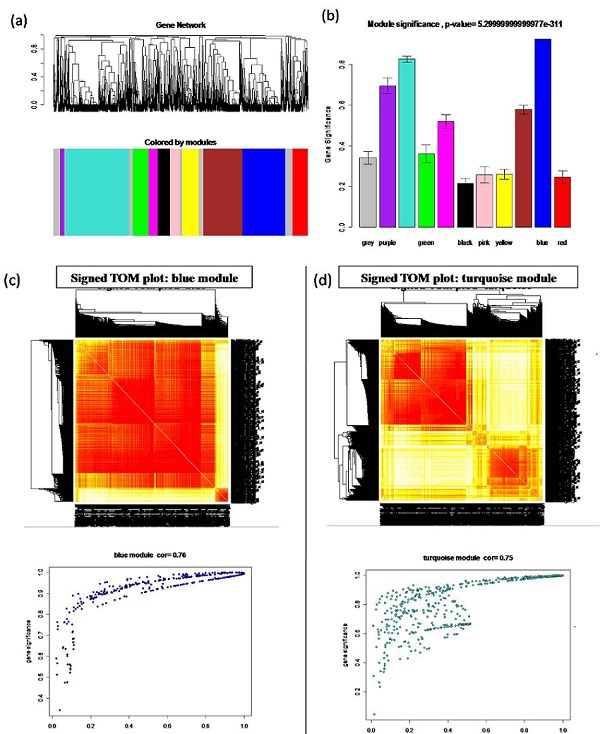
Figure 1.

Identification of coexpression network modules using spatial-temporal dataset of rice under drought stress. (a) Hierarchical clustering of the Topological Overlap Measure (TOM) matrix for the expression data. Branches of the hierarchical cluster tree define 11 modules with assigned color. (b) Bar plots showing modules significance. Note that the blue and turquoise color modules are with highest significance value. Grey was reserved to color genes that are not part of any module. (c) Signed TOM plot (top) and the MDS plot (bottom) of blue module with significant correlation value (r = 0.76). (d) Signed TOM plot (top) and the MDS plot (bottom) of turquoise module with significant correlation value (r = 0.75).
