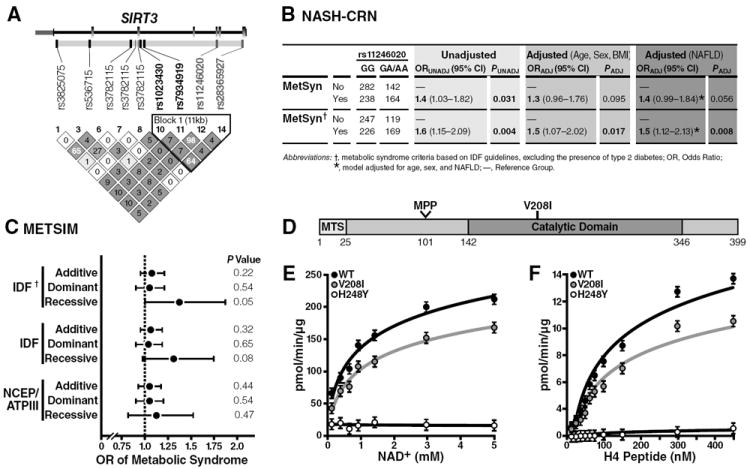
Fig. 6. A functional SNP in the human SIRT3 gene is associated with human metabolic syndrome and encodes a point-mutation.

(A) Heat map detailing the pairwise LD among the 7 SNPs spanning the SIRT3 coding region; the pairwise correlations (D’) are rendered within each diamond with greater LD reflected by darker shades of gray; SIRT3 gene structure is depicted above the LD heat map: exons are depicted in gray boxes, introns as connecting black lines, and untranslated regions as smaller boxes shades in pink; approximately 10 kbp of flanking DNA sequence was included in the tagSNP selection procedure; tagSNPs the promoter region is included in the diagram to the right of the transcription start site indicated by the arrow found directly above the SIRT3 gene structure diagram; SNPs rendered in bold are included in the haploblock outlined in the black triangle; the two SNPs that encode for nonsynonymous polymorphisms (rs11246020 and rs28365927; green). (B) Association of SIRT3 rs11246020 with the metabolic syndrome in the NASH-CRN cohort. Abbreviations: P, p-value for the test statistic; OR (95% CI), the odds ratio and 95% confidence interval for the test statistic; VNTR, variable number tandem repeat; UNADJ, unadjusted; ADJ, adjusted for age, sex, and BMI unless otherwise indicated. (C) Association of SIRT3 rs11246020 with the metabolic syndrome in the METSIM cohort, adjusted for age and BMI. †Metabolic syndrome criteria based on the IDF guidelines, excluding the presence of type 2 diabetes. *p-value for the overall model. (D) Schematic of SIRT3 protein; mitochondrial targeting sequence (MTS), mitochondrial processing peptidase (MPP) site. (E, F) Steady-state kinetic analyses of SIRT3 activity; rates of activity were measured as a function of [NAD+] (E) or [3H-histone H4 peptide] (F), as measured by organic-soluble radioactive signal, n=3 independent measurements/sample, ±SEM.
