
Figure 3.
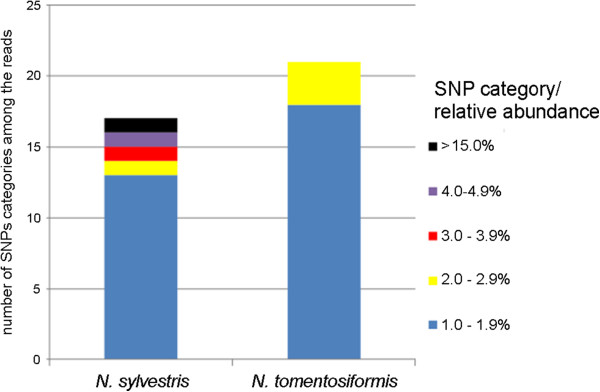
Number of ITS1 variants occurring in each of five abundance categories for N. sylvestris or N. tomentosiformis. Only SNPs that exceeded 1% of total Illumina reads in the appropriate species were considered. The graph reports the frequency of the most abundant SNPs – i.e. in N. sylvestris there is one major SNP that occurs in 15.5% of reads (black column) plus several minor SNPs occurring at lower relative abundance.