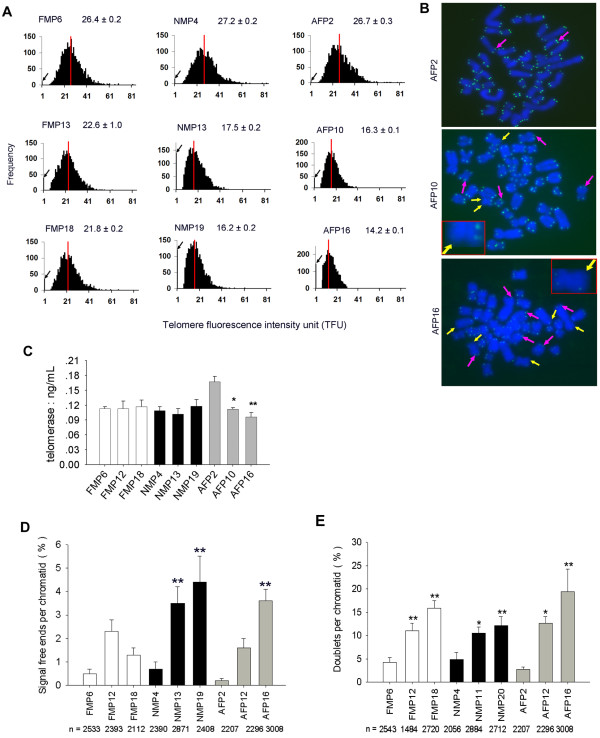
Figure 3.
Telomere length by metaphase Q-FISH analysis of various porcine cell types during subculture. (A) Telomere distribution and length from various pig cells during subculture. The medium telomere length (red bars) is also shown as mean ±SE in the upper right hand corner. Black arrows on the Y-axis indicate frequency of telomere signal-free ends. (B) Representative image of adult fibroblasts (AF) during subculture from early to late passage. Purple arrows, telomere doublets; Yellow arrows, telomere signal-free ends. (C) Quantification of telomerase activity of various pig cell types by ELLSA. *, p < 0.05; **, p < 0.01, compared to the earliest passage of the same cell type. (D) Frequency of telomere signal-free ends in 3 types of pig cells during subculture; n, number of telomeres counted; %, number of signal-free ends per chromatid. (E) Percentage of telomere doublets in 3 pig cell types during subculture; %, number of doublets per chromatid. *, p < 0.05; **, p < 0.01, compared to the earliest passage.

