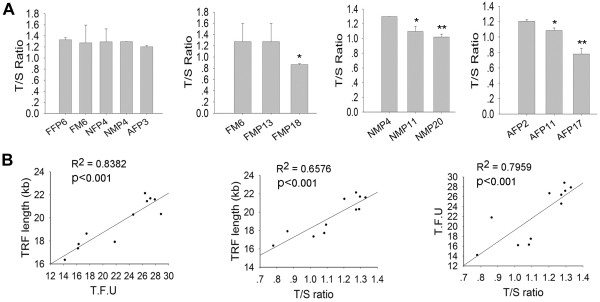
Figure 5.

Telomere measurements of pig cells shown as a T/S ratio by qPCR and its correlation with TRFs, and TFU by Q-FISH. (A) Average relative telomere length shown as T/S ratios of various cell pig cells and during passage by qPCR method. T, telomere; S, 36B4 single-copy gene. P, passage. *, p < 0.05; **, p < 0.01, compared to the earliest passage. (B) Correlation of telomere length between TFU by Q-FISH, T/S ratio by qPCR, and TRFs (kb) by Southern blot.
