
Figure 11.
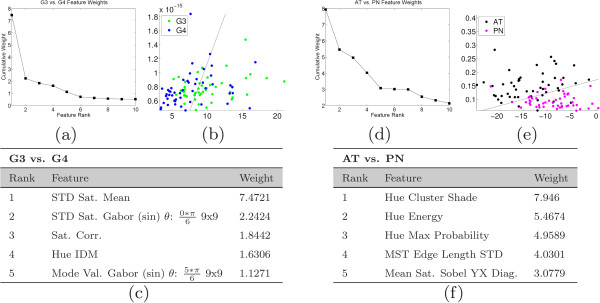
Results of feature selection - G3 vs. G4 and AT vs. PIN. Results of feature selection when distinguishing between Gleason grade 3 (G3) vs. Gleason grade 4 (G4) on the left, and Atrophy (AT) vs. PIN on the right. Shown are: (a), (d) the plots of the cumulative weights as a function of feature rank, (b), (e) scatter plots of the first and second features along with the optimal discriminating hyperplane, and (c), (f) a list of the feature names associated with each rank.