
Figure 12.
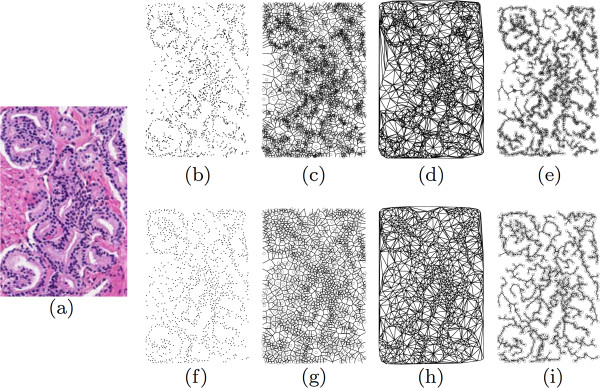
Graphs representing automated vs. manual nuclei detection. Examples of feature images obtained for a Gleason grade 3 image via manual (b)-(e) and automated (f)-(i) nuclear annotations. Shown are the original image at left, followed by the nuclear locations ((b), (f)), Voronoi diagrams ((c), (g)), Delaunay triangulation ((d), (h)), and minimum spanning trees ((e), (i)). Although the automated annotation tends to pick up multiple false positives, the feature values listed in Table 3 indicate that the differences are not statistically significant for each image class.