
Figure 2.
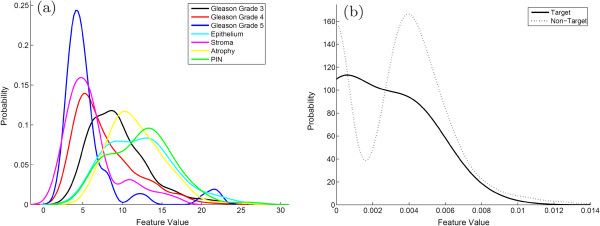
Probability density functions for OSC and OVA. Illustration of probability density functions, where the likelihood of observing a particular class (dependent axis) is plotted against a feature value (independent axis). Shown are two different multi-class strategies: (a) OSC, where all classes are plotted simultaneously, and (b) OVA, where a “Target” class is separated from a heterogeneous “Non-target” class. A heterogeneous set of tissues in the non-target class can lead to multi-modal density functions, illustrated by the dotted line.