
Figure 3.
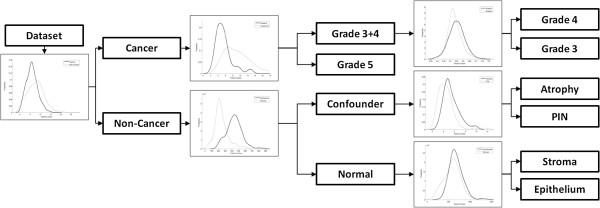
Illustration of the cascaded (CAS) approach. Each probability density function represents a single binary classification task. Beginning at the left, all images in the dataset are classified into either cancer or non-cancer categories. A new binary classification is then performed: cancer images are classified as Gleason grades 3/4 or grade 5, and non-cancer images are classified as confounder or normal images. The final set of binary classifiers separates the Gleason grade 3+4 group into G3 and G4 separately, confounder images are identified as AT or PIN, and normal images are identified as BS or BE.