
Figure 4.
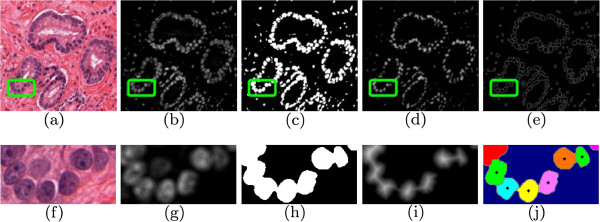
Overview of automatic nuclei detection. Shown are: (a), (f) the original tissue image, (b), (g) the result of color deconvolution to isolate the nuclear stain, (c), (h) the result of thresholding to get nuclear regions, (d), (i), the result of the Euclidean distance transform on the thresholded image, and (e), (j) the result of watershed segmentation of the nuclear boundaries. In (j) the different regions have been marked in color, and the nuclear centroids have been labeled.