
Figure 7.
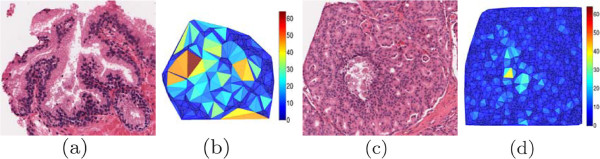
Illustrated differences in feature values. Illustration of the difference in feature values between two different tissue class images. Shown are (a) a benign epithelium tissue image with (b) its Delaunay triangulation, where the color of each triangle corresponds to an area value (blue represents low area, while red represents high). There is a clear difference when compared with (c) a Gleason grade 5 tissue sample and (d) its associated graph, indicating that architectural features are effective at discriminating tissue classes.