
Figure 9.
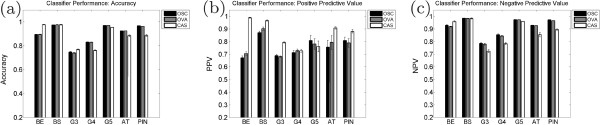
Classifier performance for OSC, OVA, and CAS. Average performance measures from the three different classification strategies: OSC (one-shot classification), OVA (one-versus-all classification), and CAS (our cascaded approach). Shown are the values for (a) accuracy, (b) positive predictive value (PPV), and (c) negative predictive value (NPV) with each group representing a separate tissue class. Error bars represent standard error over 20 trials. In terms of accuracy, the different algorithms perform similarly, with CAS showing a small advantage for most tissue classes; however, in terms of PPV, the cascaded approach out-performs both OSC and OVA in the majority of tasks, particularly with Gleason grade 3 and grade 4 tissue.