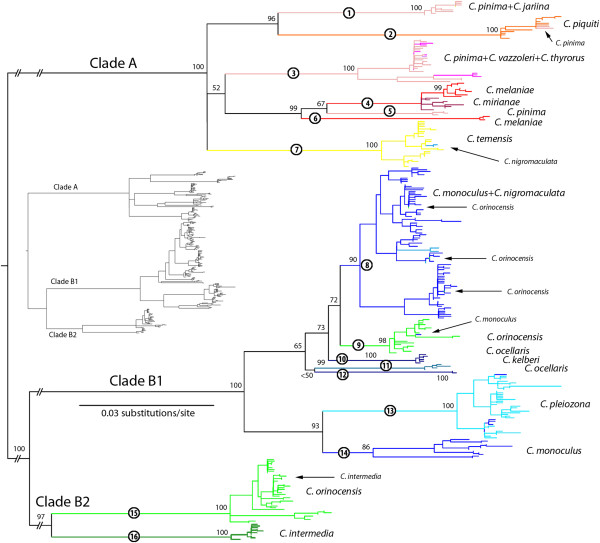
Figure 2 .
Mitochondrial genealogy inferred from Treefinder, with haplotypes as terminals. The tree is a maximum likelihood phylogram. Labeled branches (circled numbers) are referred to in the text. Stable, major mtDNA lineages are labeled (A, B1, B2). Branch colors correspond to the described species, and instances of morphotype-lineage mismatch interpreted as recent introgression are identified with arrows and smaller text. Branch values are bootstrap percentages. Note: basal branches of the tree are truncated for presentation, while the inset shows the non-truncated tree.

