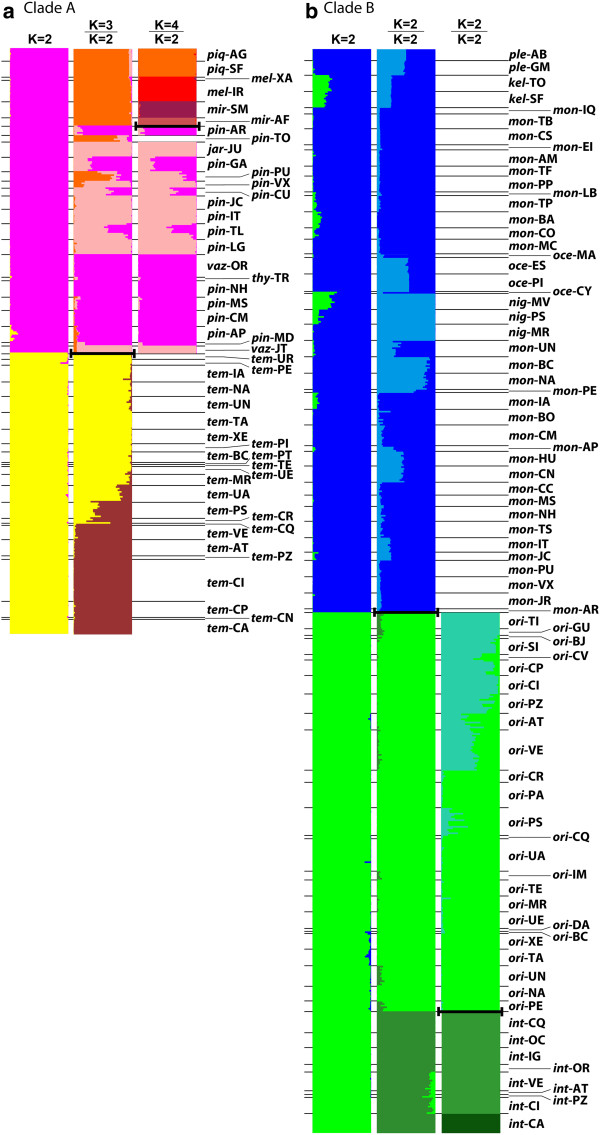
Figure 4.
Results of the microsatellite analyses, using the Structure divide-and-reanalyze approach. Colors were chosen to represent the described species, but do not strictly correspond. Horizontal lines indicate the division of individuals from the same locality, which are identified by described species (first three letters of the species name) and locality abbreviation (Table 1). Bold lines indicate where data was divided for separate analysis, and K values above each column indicate optimal clustering on either side of the bold line. a) Clade A (N = 360). b) Clade B (N = 666).

