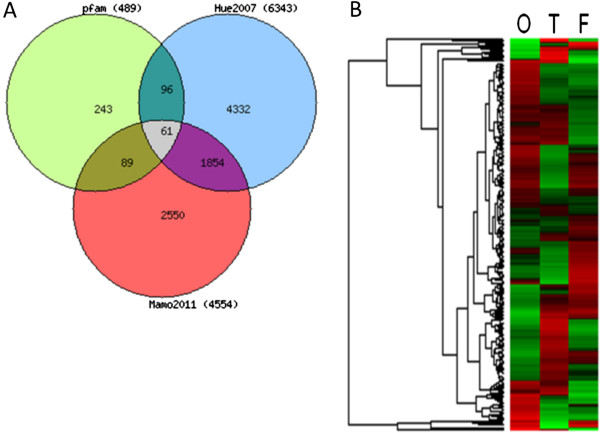
Figure 7.

TF expressed in bovine elongating tissues. A) Venn diagram including the Pfam-HomoloGene TF from the current work (n=489) from previous studies [41,43]. B) Pfam-HomoloGene TF (severine, n=243) as expressed in the array dataset from [41]. O, T and F for: Ovoid, Tubular and Filamentous stages.
