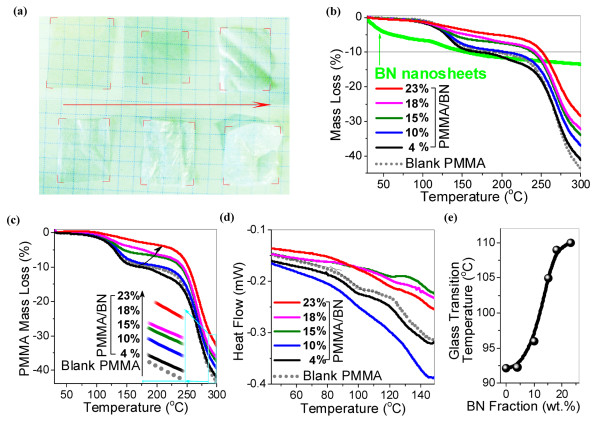
Figure 3.
Thermal stability of polymeric composites. (a) Optical photos of blank PMMA and PMMA composites with 4, 10, 15, 18 and 23 wt.% of BN arranged from left to right and from top to bottom. (b) TG curves of blank PMMA, PMMA/BN composites, and pure BN nanosheets. The mass loss of BN nanosheets might result from the loss of surface-adsorbed/functionalized water or organic groups due to ionic B-N bond characteristics. (c) Weight change of PMMA components in blank PMMA and in PMMA/BN composites. The mass loss was normalized to the weight of PMMA after removal of the BN component mass loss. (d) Typical DSC curves of blank PMMA and PMMA/BN composites. Second scans were used here to release a thermal stress. Tg was determined at the mid-point in a three-tangent method. (e) The increased Tg along with increasing filling fraction of BN nanosheets.

