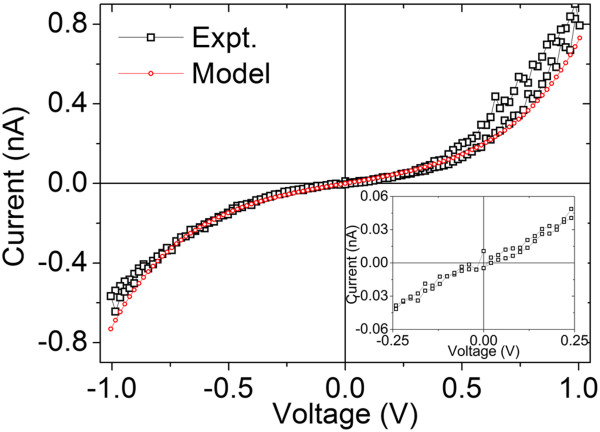
Figure 6.

Linear-scale I-V curve and its theoretical fitting curve recorded after being switched into high-resistance state. I-V curve recorded at 300 K after being annealed under positive (+4 V) bias voltage at 425 K (the same I-V curve as that denoted by triangle in Figure 5b). Inset is an I-V curve recorded within a small sweep range near zero bias.
