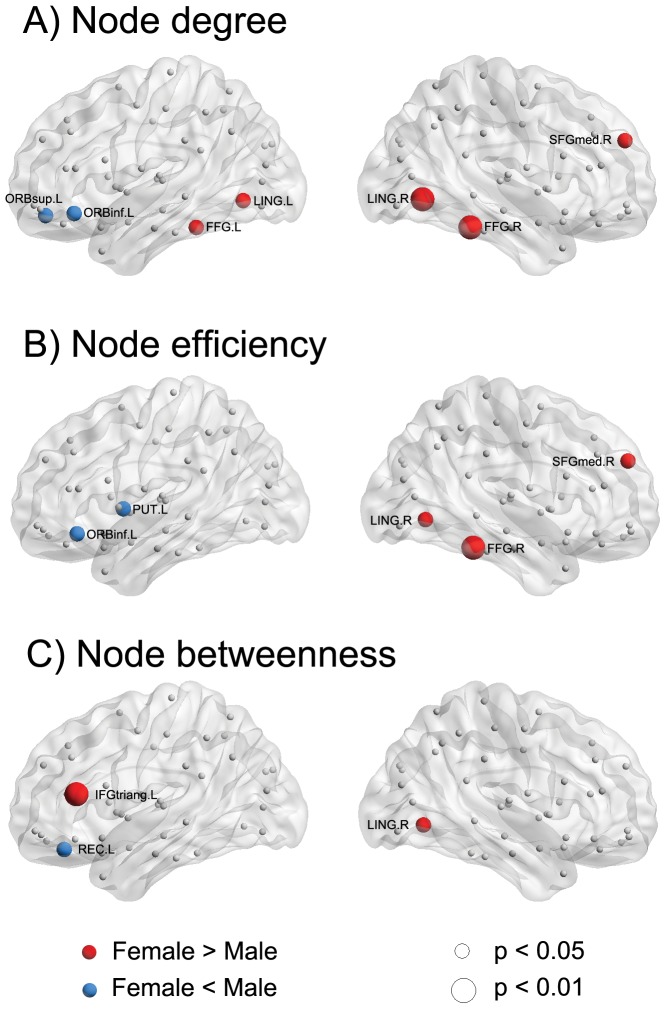
Figure 4. Effect of sex on regional nodal properties.
The significant higher values of regional nodal parameters in female and male groups are shown in red and blue, respectively. The significances of p<0.05 and p<0.01 (uncorrected) are indicated by spheres in small and big size, respectively. For a description of the abbreviations, see Table S1.

