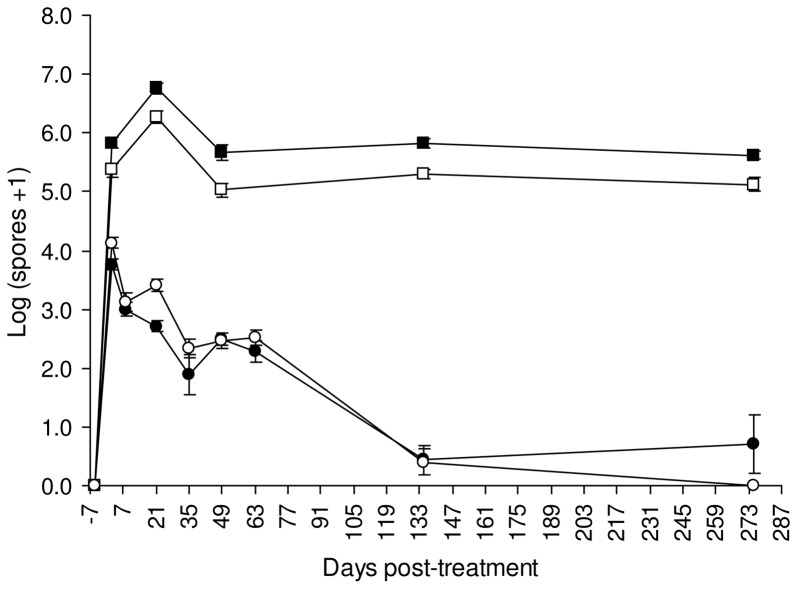
Figure 2. Evolution of Lysinibacillus sphaericus and Bacillus thuringiensis israelensis spores in water and sludge samples collected in treated catch basins (average±SE).
Symbols: ○ = Lsph spores per ml of water; • = Bti spores per ml of water; □ = Lsph spores per gram of sludge; ▪ = Bti spores per gram of sludge.

