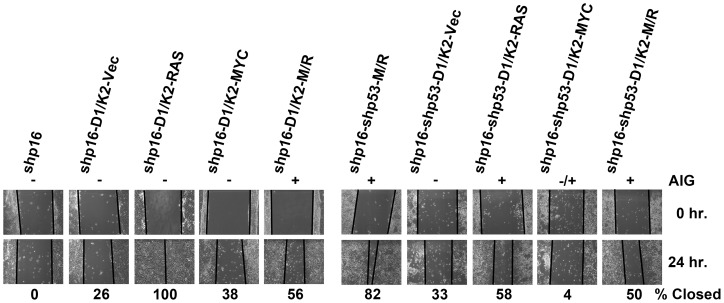
Figure 6. Cell derivatives capable of AIG demonstrate increased motility.
Representative pictures of wound healing scratch assay of each HMEC derivative generated to represent all combinations of CCND1/CDK2 (D1/K2) replacements in the transformation protocol. Solid black lines represent cell fronts. Numbers beneath pictures indicate percent closure of scratch at 24 hours. The ability of the cell derivatives to grow anchorage independently is represented above the pictures (+ = growth, − = no growth, −/+ = intermediate growth).

