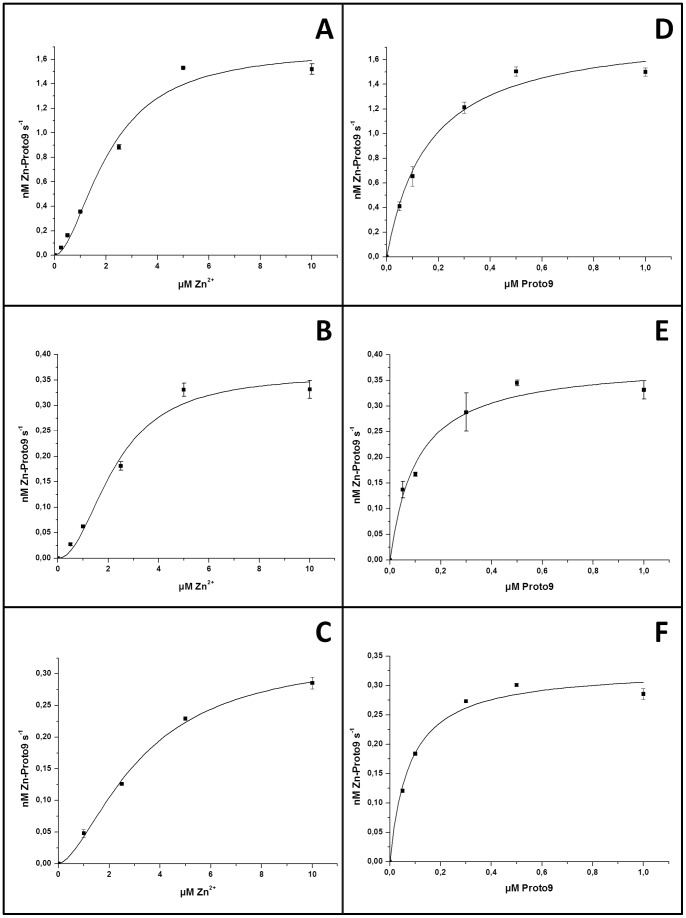
Figure 6. Enzyme kinetic plots for FeCh and FeChΔ347 lacking His6-tags.
30 nM enzyme was analyzed in a continuous assay at 30°C. Hill equation fit relating initial rate (nM Zn-Proto9 s−1) to Zn2+ concentration for FeChΔ347 (A), co-expressed FeCh (B) or refolded FeCh (C) to Zn2+ concentration. Michaelis-Menten equation fit was used when the variable substrate was Proto9 for FeChΔ347 (D), co-expressed FeCh (E) or refolded FeCh (F). Error bars represent standard deviation (n = 3). “Refolded FeCh” corresponds to in vitro folded enzyme, while “co-expressed FeCh” was co-expressed with chaperones assisting folding in E. coli cytosol.

