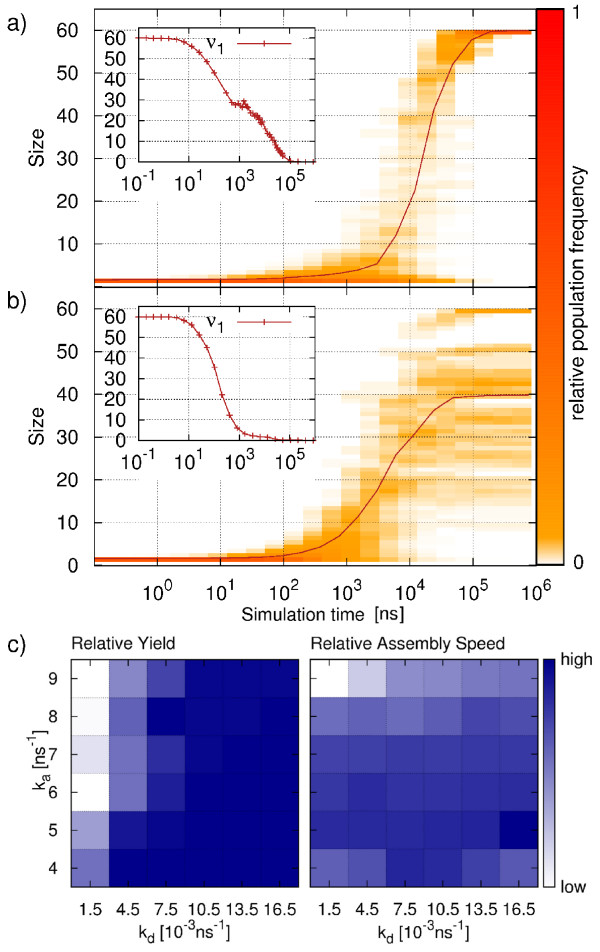
Figure 2.
T1 direct assembly. a) and b) show the relative population of different cluster sizes as a function of time for a favorable (ka=5.0 ns−1, kd=13.5·10−3 ns−1) and a unfavorable (ka=8.0 ns−1, kd=1.5·10−3 ns−1) set of parameters, respectively. The average cluster size is shown as solid line. In the inset the monomer population ν1(t)is shown as a function of time. c) Parameter space analysis of direct assembly. Relative yield (left) and relative assembly speed (right) are depicted using a heat-map representation for various combinations of kaand kd. All data are obtained from 40 independent simulation runs.

