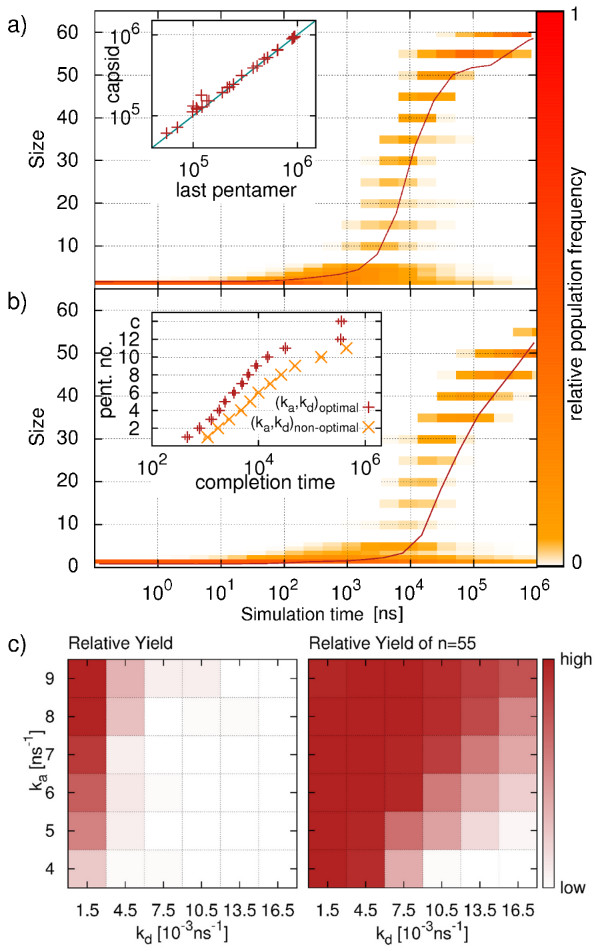
Figure 3.
T1 hierarchical assembly. a) and b) show the relative population for a favorable (ka=8.0 ns−1, kd=1.5·10−3 ns−1) and unfavorable (ka=5.0 ns−1, kd=1.35·10−2 ns−1) set of parameters, respectively. The average cluster size is shown as solid line.In the inset of a) the FPT(nf) is plotted against the FPT of the last pentamer. The inset of b) shows the completion times of the pentamers for the parameter sets analyzed in a) and b), respectively. c) Parameter space analysis of hierarchical assembly. The relative yield of full capsids (left) and of clusters of size n=55 (right) are depicted using a heat-map representation for various combinations of kaand kd. All data are obtained from 40 independent simulation runs.

