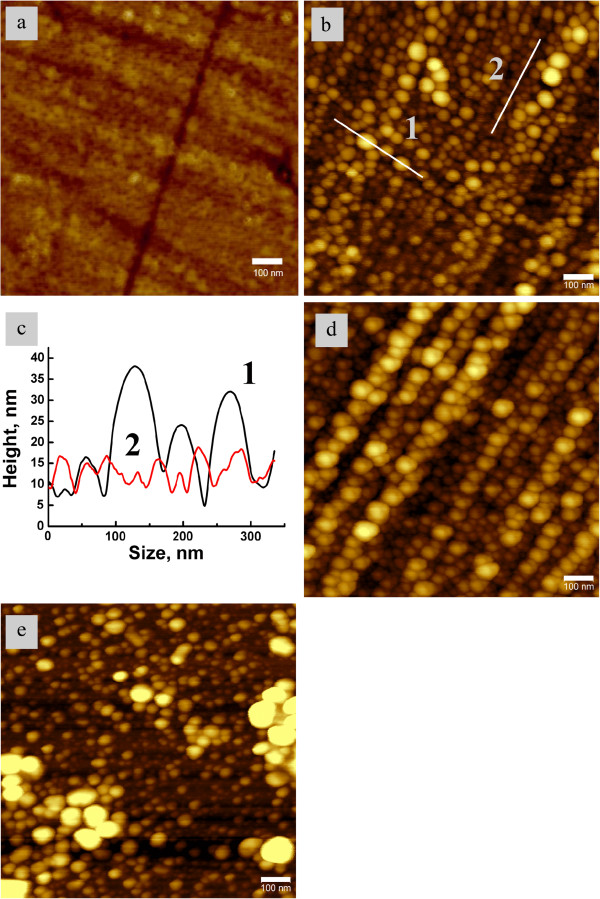
Figure 1.
AFM images of the samples: (a) initial glass surface; (b) glass surface after the first anneal; (c) the profiles of bigger (1) and smaller (2) islands measured along lines 1 and 2 in image (b); the widths of maxima correspond to the particles size; (d) another region of the glass surface; (e) glass surface after 9 cycles of ‘removal-anneal’.

