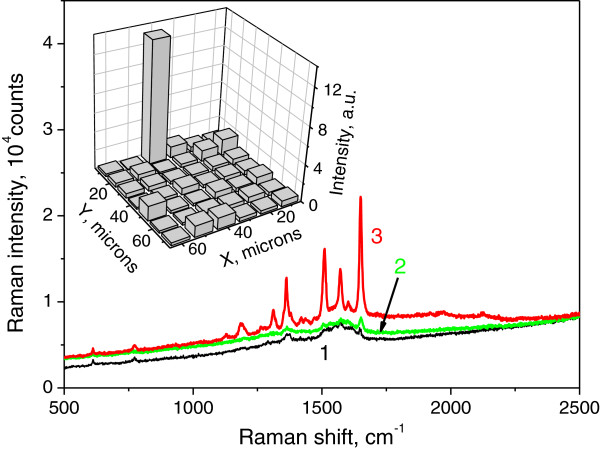
Figure 4.
SERRS spectra (R6G 10−7M film) measured at different positions in mapped area. These positions correspond to 1,651 cm−1 line intensity below the average value (curve 1), above the average value (curve 2), and to ‘anomalous spot’ (curve 3). Inset: the SERRS signal mapping (at line 1,651 cm−1) for R6G 10−7 M film. Scan area, 60 × 70 μm2; step, 10 μm; vertical axis, intensity of the 1,651 cm−1 line in counts.

