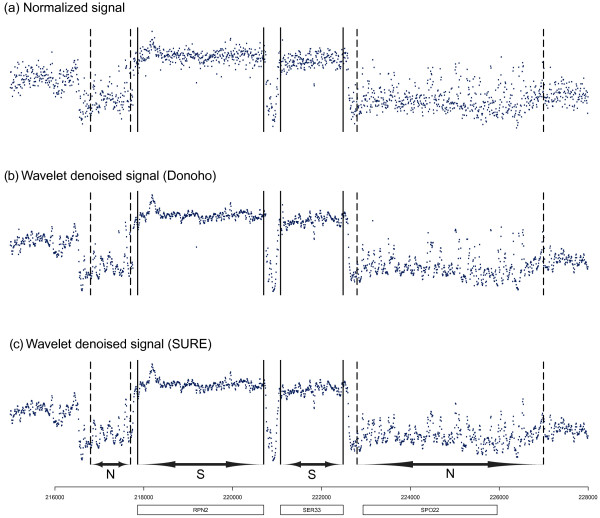
Figure 2.
Signal to noise ratio of different filtering methods. Portion of the tiling signal used to evaluate the Signal to Noise Ratio (SNR). We consider two signal regions (S) and two noise regions (N). (a) Normalized signal. (b) Denoised signal using Donoho’s threshold. (c) Denoised signal using the SUREShrink threshold.

