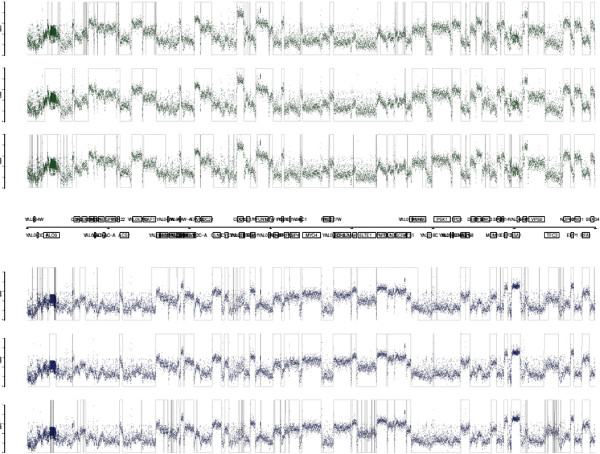
Figure 3.
Wavelet-based segmentation of S. cerevisiae tiling signal. Visualization of S. cerevisiae tiling microarray signal along 140 kb of chromosome 1. Each dot corresponds to a probe of the forward strand (top) and reverse strand (bottom). The superimposed pulse signal represents the segmentation obtained using the different methods (PMSW, SCM, ZCL). The parameters of the different analysis are described in the Results and discussion section of the manuscript.

