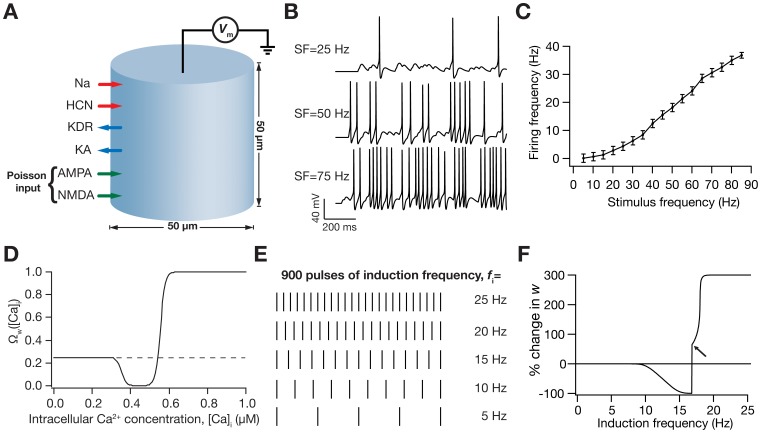
Figure 1. Illustration of the model and its basic properties.
(A) Schematic of the single compartment model used in this study. The various ligand- and voltage-gated channels used in the model are depicted as arrows, and the transmembrane voltage Vm was recorded in response to Poisson-modulated excitatory synaptic inputs or to pulse current injections. (B) Voltage traces (for 1 s) depicting neuronal firing for Poisson-distributed synaptic stimulation at various stimulus frequencies (SF). (C) Plot showing firing frequency (FF) as a function of SF. Data represented as mean ± SEM for 100 trials of Poisson-distributed synaptic stimulation at each SF. (D) Functional form of the plasticity-regulating  (Equation 14) plotted as a function of intracellular calcium levels. (E) Synaptic plasticity was induced by stimulating the colocalized NMDAR-AMPAR synapses with 900 pulses of various induction frequencies (f
i) spanning a range of 0.5–25 Hz. Depicted are pulses for five different frequencies for a period of 1 s. As the number of pulses was set at 900 irrespective of the induction frequencies, induction of plasticity through a lower frequency pulse will run for a longer time compared to induction through a higher frequency pulse. (F) BCM-like synaptic weight (w) change induced through various induction frequencies. Arrow indicates the initiation of spikes during the induction protocol.

