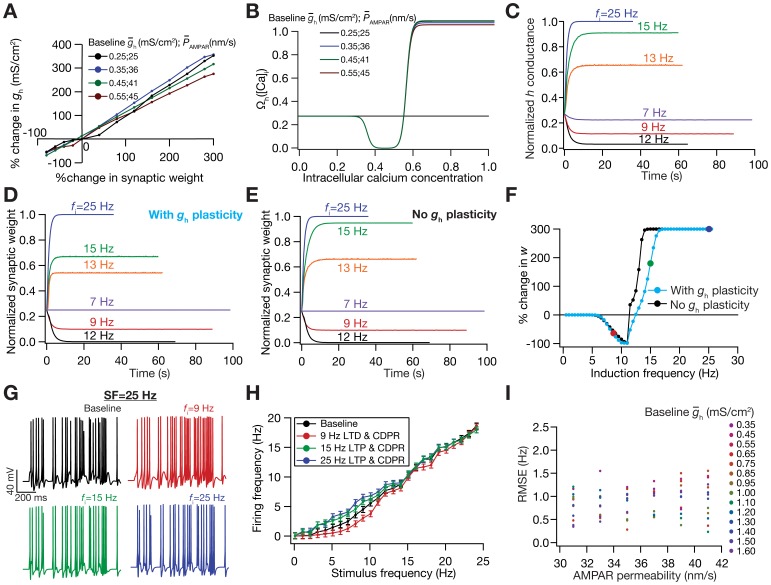
Figure 4. Calcium-dependence of h-conductance plasticity was deduced from the linear relationship between synaptic plasticity and HCN channel plasticity required for maintaining firing rate homeostasis.
(A) Change in h conductance required to achieve homeostasis in the FF vs. SF plot was linearly related to the change in the synaptic weight for different induction frequencies (f
i), for a range of values of  and baseline
  . (B) Plot showing
  function (in Equation 41) as a function of [Ca2+]i. Note that the color codes for traces in (A) and (B) are the same. (C–D) Temporal evolution of normalized h conductance (C) and normalized synaptic weight, w (D), when the model was stimulated with 900 pulses of different values of f
i. Plots depict the case where synaptic plasticity and CDPR were both induced in parallel. (E) Same as (D), but plots depict the case when only synaptic plasticity was induced. (F) BCM-like synaptic plasticity profiles, with (cyan) and without (black) CDPR. (G) Voltage traces depicting neuronal firing for a 25 Hz stimulus. Top left: baseline. The other three traces depict neuronal firing after parallel Ca2+-dependent induction of synaptic and HCN channel plasticity. Induction frequencies for top right: 8.5 Hz; Bottom left: 15 Hz; Bottom right: 19 Hz. Refer to color codes in (F). (H) FF vs. SF plots after induction of different magnitudes/direction of synaptic plasticity, when CDPR was induced in parallel, compared with baseline FF vs. SF (black). Note that the color codes representing different frequencies are the same from (C)–(H). (I) Sensitivity analysis of CDPR for
  and baseline
  , showing the root mean square error in firing rates between the baseline FF-SF plot and the one obtained after inducing LTP (25 Hz/900 pulses) in parallel with CDPR.

