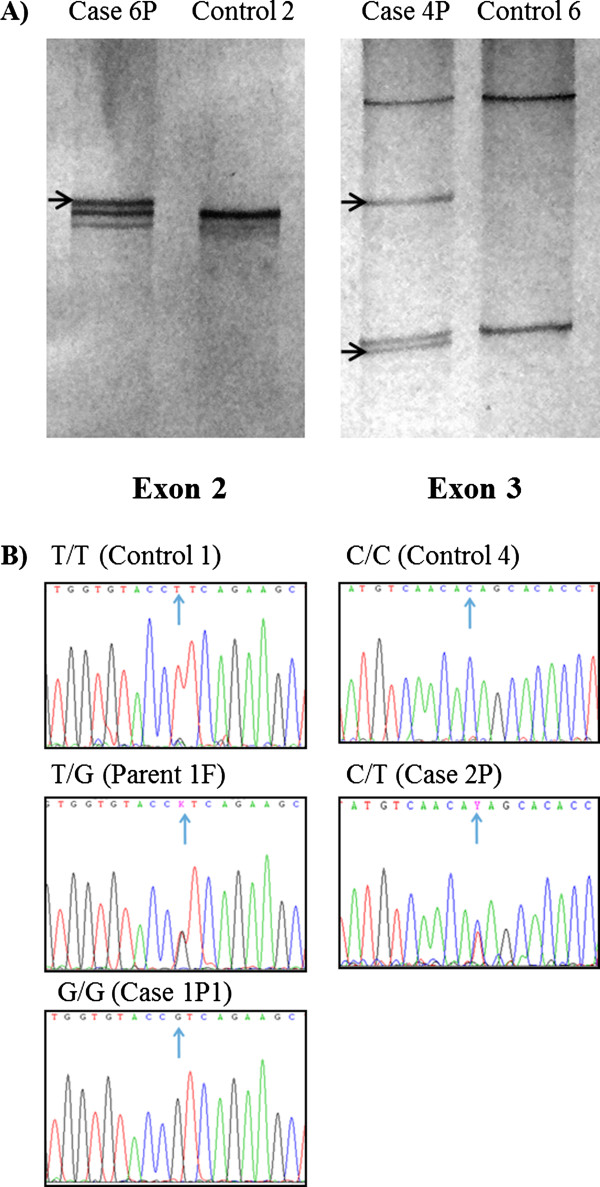
Figure 2.

Mutational analysis of Cathepsin C gene. A) Representative results of CTSC gene exon scanning by single-strand conformation polymorphism (SSCP). Reannealed products, in silver-stained polyacrylamide gels, of exons 2 (left) and 3 (right) in cases 6P and 4P showed differences (arrows) against controls 2 and 6. B) Representative electropherograms of exon 2 showing genotypes (arrows) homozygote normal T/T (control 1), heterozygote T/G (parent 1 F) and homozygote mutated G/G (case 1P1), for mutation c.203 T >; G. Exon 3, showing genotypes (arrows) homozygote normal C/C (control 4) and heterozygote C/T (case 2P) for polymorphism c.458C >; T.
