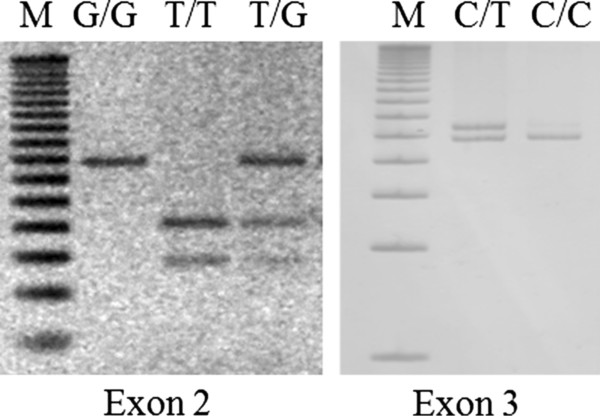
Figure 3.

Gene polymorphisms analysis. PCR-RFLPs products of genotypes homozygous normal T/T, heterozygous T/G and homozygous mutated G/G for mutation c.203 T >; G of exon 2 (left). Genotypes homozygous normal C/C and heterozygous C/T, for c.458C >; T polymorphism of exon 3 (right). M, 50 bp DNA ladder (Invitrogen).
