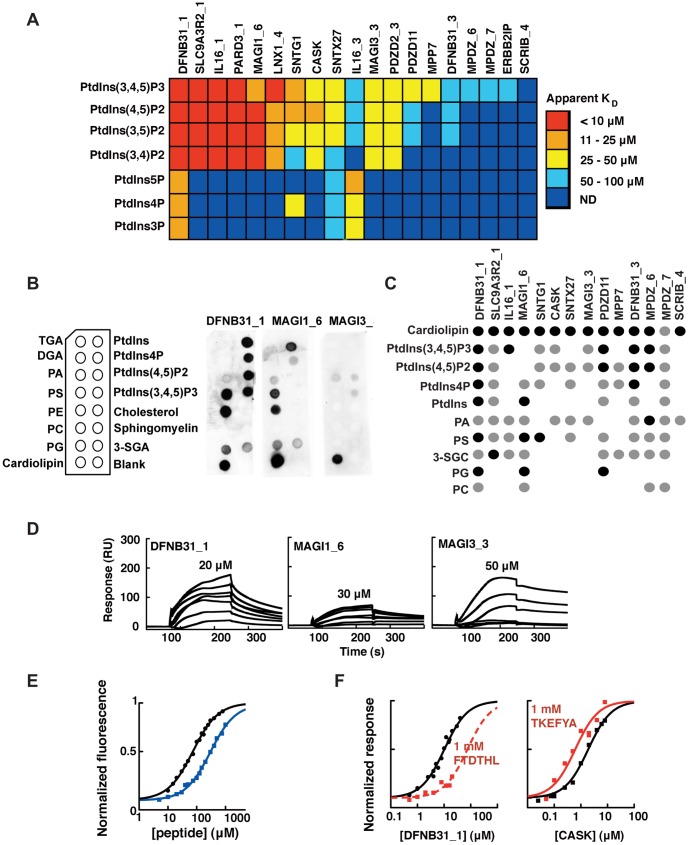
Figure 4. Lipid binding profiles of PDZ domains and differential effects of peptide ligands on PtdInsPs binding.
A. Apparent PDZ-PtdInsPs affinities as determined by SPR equilibrium binding experiments between his-tagged PDZ domains and 5% PtdInsPs (DOPC liposomes). The color code is indicated to the right. Dark blue color indicates that values were not determinable, for apparent KD values see Table S2. B. Schematics of the pre-spotted lipid blot membrane together with representative lipid blots of DFNB31_1, MAGI3_3 and MAGI1_6. C. Overview of the lipid blot analysis. Detected spots are represented by black filled circles for intense signals or grey for weaker signals, as compared within each membrane. No binding was detected for TGA, DGA, PC, cholesterol or sphingomyelin. D. Double reference subtracted sensorgrams of DFNB31_1, MAGI1_6 and MAGI3_3 injected over 10% PS containing DOPC liposomes. The highest protein concentration used is indicated for each protein. E. Equilibrium peptide binding titrations of DFNB31_1/Y167W and the C-terminal peptide of usher (FTDTHL, black circles and black line), and CASK/I517W and the C-terminal peptide of syndecan2 (TKEFYA, blue squares and blue line) as followed by changes in intrinsic tryptophan fluorescence. The protein concentrations were kept constant at 3 µM. F. Equilibrium binding isotherms of DNB31_1 (left panel) and CASK (right panel) to 5% PtdIns(4,5)P2 (DOPC liposomes) as determined by SPR experiments in absence (black lines) and presence (red lines) of 1 mM of respective peptide ligands. Note the apparent decrease and increase in affinity in presence of peptide for DFNB31_1 and CASK, respectively.

