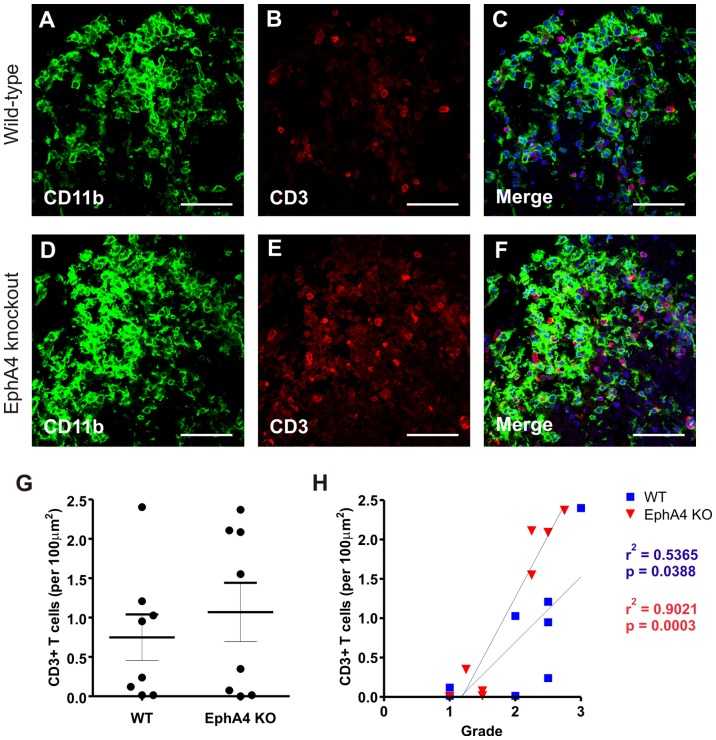
Figure 3. T lymphocyte infiltration in EAE-affected wild-type and EphA4 knockout spinal cords at 20 days post-immunisation.
Inflammatory white matter lesions in both EAE-affected wild-type and EphA4 knockout lumbar spinal cords (visualised as CD11b+ areas in A, D) display a robust infiltration of CD3+ T cells (B, E, and merged in D, F). There was no significant difference (p>0.05) in the number of T cells present in the spinal cord lesions of wild-type and EphA4 knockout mice (G). In both genotypes, there was a significant (p<0.05) correlation between the number of T cells present in lesions and the highest clinical grade reached per mouse (H). Merged images include DAPI nuclear counterstain. Scale bars A−F = 50 µm. Results in G show the mean±SEM of n = 8 wild-type (WT) and n = 8 EphA4 knockout (KO) spinal cords of mice of clinical grades 1 to 3.

