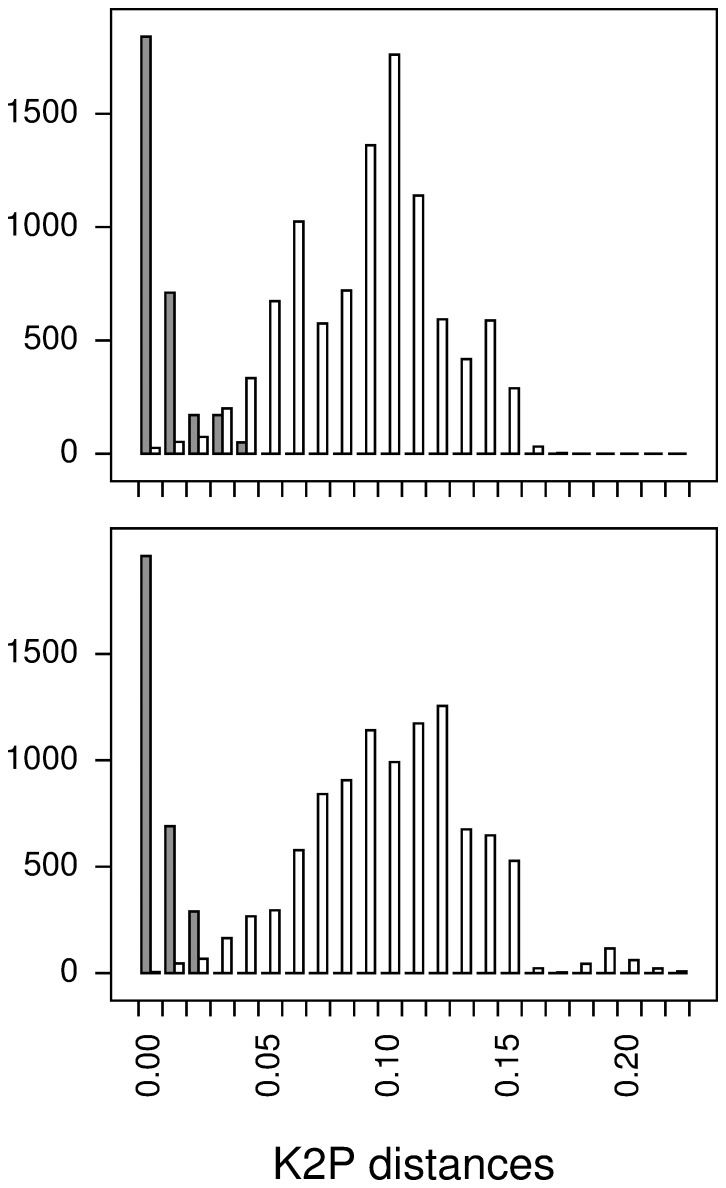
Figure 1. Intra- and interspecific K2P distances.
The top panel shows distances between COI barcode regions, and the bottom panel shows distances between specimens using all three gene regions. Dark bars show intraspecific distances and light bars show interspecific distances. The counts of intraspecific distances have been scaled tenfold for clarity.

