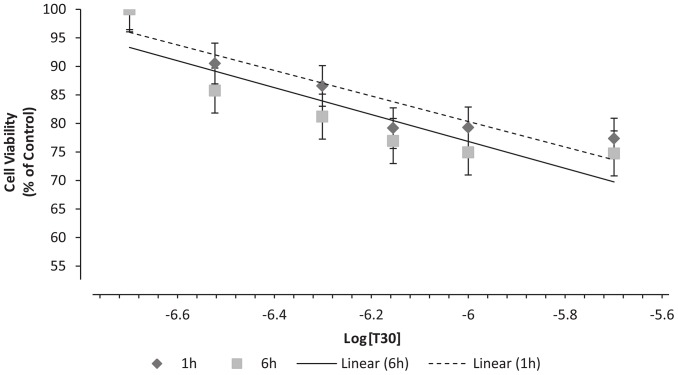
Figure 2. Dose-response curves representing cell viability (% of control) after 1 and 6 h of treatment with AChE C-terminus peptides of 30 amino acids (T30) with concentrations.
Data are presented as the percentage (of control) of the mean ± S.E.M. from five independent experiments carried out on triplicates (*P<0.05, N = 5).

