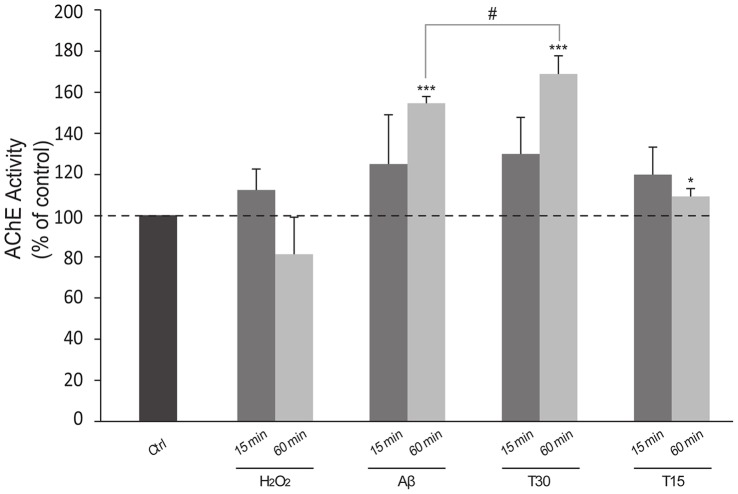
Figure 6. Bar graph shows the increase of Acetylcholinesterase (AChE) activity.
Cells were treated for 15 and 60 minutes with Hydrogen peroxide (H2O2) 100 µM, β-Amyloid (Aβ) 0.7 µM, AChE C-terminus peptides of 30 amino acids (T30) 0.7 µM and the residual 15 amino acid sequence (T15) 0.7 µM. Data are presented as the percentage of the mean ± S.E.M. divided by the number of extant cells and obtained from independent experiments carried out on triplicates. *P<0.05 and ***P<0.001 vs Control; # P<0.05 between T30 treatments. Dotted line shows basal AChE activity (Control 100%).

