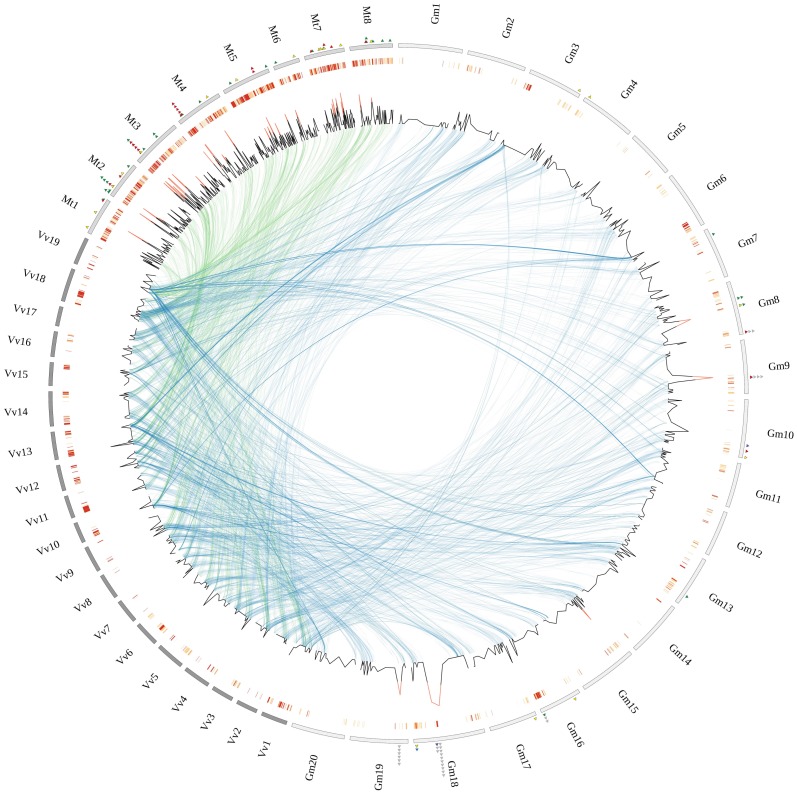
Figure 1. Homologous segments between V. vinifera and two legume species, G. max and M. truncatula.
The outer circle shows numbered chromosomes of each species in gray (M. truncatula, Mt), light gray (G. max, Gm) and dark gray (V. vinifera, Vv). Local duplications are represented in the second outer circle, where red denotes higher density of tandem duplications in a particular region. The line plot illustrates the number of FBX genes in each interval of 100 genes. If 5 or more FBX genes are present in a given region, the peak is colored in red. Internal arcs connect syntenic regions between V. vinifera/G. max (blue) and V. vinifera/M. truncatula (green). Colored triangles represent tandemly-duplicated FBX genes with preferential expression in late-development seeds (green), late embryogenesis seeds (red), nodules (yellow). For Gm: no detectable transcription (gray), apical meristem (green), nodule (blue), flower (yellow) and leaves (purple).

