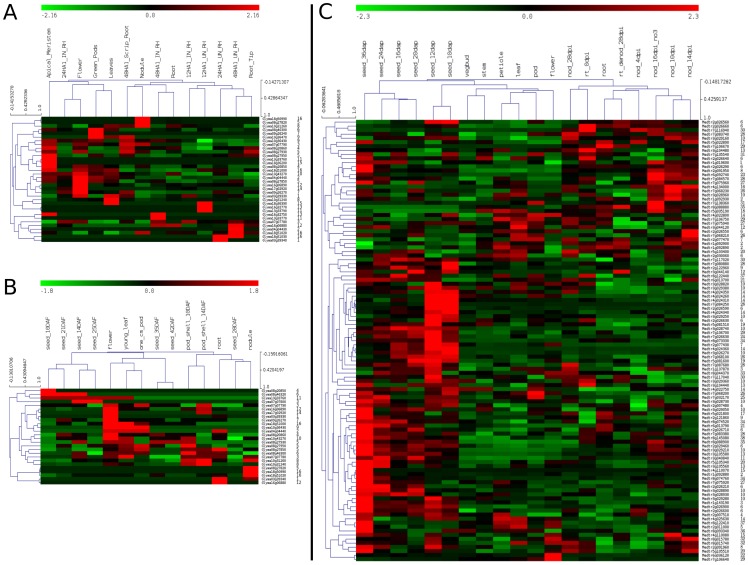
Figure 2. Transcriptional profiles of tandemly-duplicated FBX genes in G. max and M. truncatula in different tissues.
Normalized transcriptional levels were obtained from Severin at al [30] (A) and Libault et al [31] (B) (G. max) and Benedito et al (M. truncatula) (C) [39]. For each independent study, gene expression values were standardized using Z-score and clustered with Hierarchical Clustering (MeV package). Numbered labels in the right refer to tandem FBX arrays (i.e. if two genes have the same number, they are very close to each other in the genome). These labels are qualitative and thus there is no correlation between label number and genomic closeness of the tandem FBX arrays.

