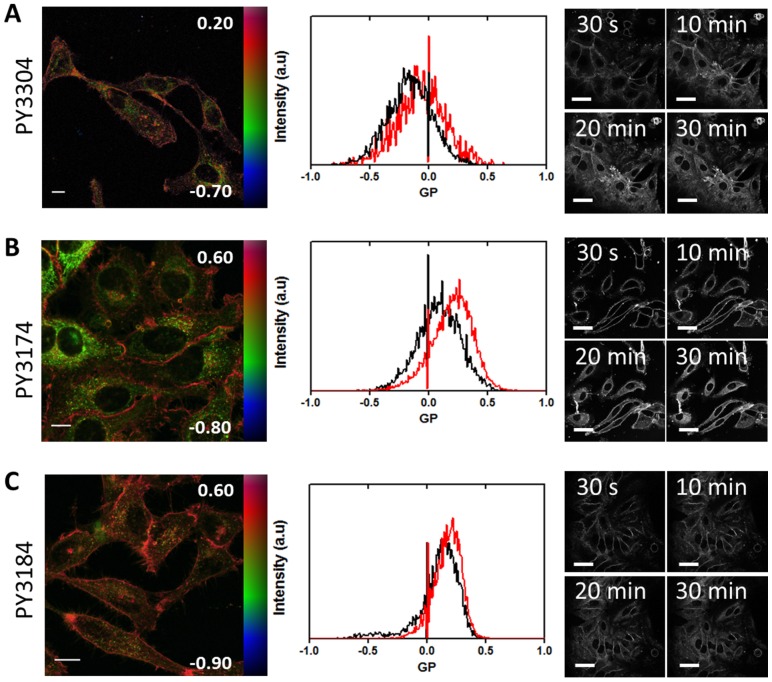
Figure 4. Analysis of live HeLa cells.
Left: GP images of live HeLa cells stained with PY3304 (A), PY3174 (B), PY3184 (C). GP images are in false color and run over the range indicated by the color bars to indicate a higher degree of membrane order (predominately colored red) in the plasma membrane compared to intracellular membranes (predominately colored green). Scale bars 10 µm. Middle: Histograms of the GP values obtained from GP images of live HeLa cells stained with PY3304 (A), PY3174 (B), PY3184 (C). Histograms obtained from ROIs for plasma membrane (red line) and intracellular membranes (black) were normalized to the total number of pixels. Right: Staining profile of Live HeLa cells. HeLa cells were incubated with PY3304 (A), PY3174 (B) and PY3184 (C) for 30 min. Confocal intensity images were acquired at 30 s, 10 min, 20 min, and 30 min after dyes were added. Images show complete staining of all cellular membranes after 30 min. Scale bars 50 µm.

