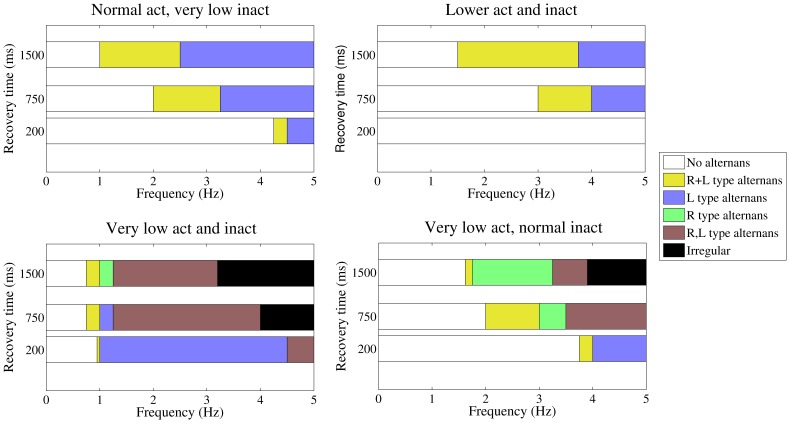
Figure 7. Mechanism underlying the onset of alternans at different pacing frequencies and RyR2 recovery times.
. The four panels illustrate how the mechanism underlying the induction of cytosolic calcium alternans varies with the stimulation frequency and RyR2 recovery from inactivation. Each panel has three rows of color bars, which indicates the responsible mechanism for the induction of alternans at the different stimulation frequencies. The top bar represents slow RyR2 recovery (τr = 1500 ms), the middle bar intermediate RyR2 recovery (τr = 750 ms) and the lower bar fast RyR2 recovery from inactivation (τr = 200 ms). Colors green, purple, yellow, and brown correspond, respectively, to the regimes R, L, R+L, and R,L of Table 1. Black indicates frequencies where irregular behavior is present. The parameters for activation and inactivation are: top panels, left: k a = 10 mM−2 ms−1, k i = 0.05 mM−1 ms−1, right: k a = 3.5 mM−2 ms−1, k i = 0.2 mM−1 ms−1; lower panels, left: k a = 1.0 mM−2 ms−1, k i = 0.1 mM−1 ms−1, right: k a = 0.6 mM−2 ms−1, k i = 0.5 mM−1 ms−1.

