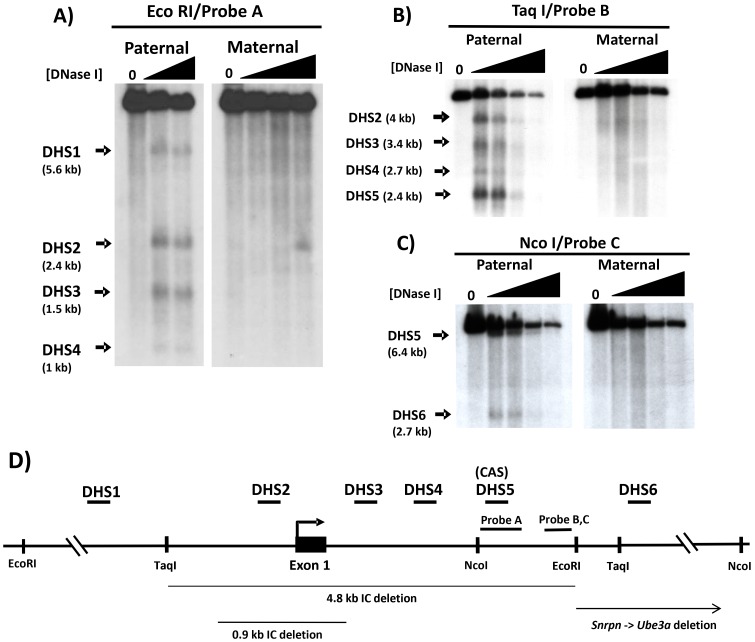
Figure 1. DNase I hypersensitivity of the murine PWS-IC.
DNase hypersensitive sites (DHS) were mapped by Southern blotting and indirect end-labeling after DNase I treatment of primary brain cells. The maternal and paternal alleles were analyzed separately using brain cells prepared from mice carrying a 35 kb PWS-IC deletion on either the paternal or maternal chromosome, respectively [8], [18]. Cells were treated with increasing concentrations of DNase I; 0 DNase samples were purified genomic DNA from untreated brain cells. (A) Analysis by EcoRI digestion and hybridization with probe A. The thick arrows indicate the positions and sizes of prominent reproducible DNase I hypersensitive bands. Paternal indicates samples carrying a maternal PWS-IC deletion; Maternal indicates samples carrying a paternal PWS-C deletion. B) Analysis by Taq I digestion and hybridization with probe B. C) Analysis by Nco I digestion and hybridization with probe C. D) Summary of DNase I hypersensitive sites and their locations. The diagram depicts the Snrpn 5′ region showing relevant restriction enzyme sites and the positions of hybridization probes A, B and C (probe B is contained within probe C). The relative positions of DHS1-6 are indicated by short horizontal bars above the gene; all prominent DH sites (DHS1-DS6) are specific to the paternal chromosome. CAS denotes the conserved activator sequence [17] that co-localizes with DHS5. Thin horizontal lines below the gene depict regions deleted by targeted knockouts of the Snrpn locus [38], [39]. The bent arrow depicts the location of the transcription initiation site. The position of each DH site relative to the transcription initiation site is estimated to be: DHS1, −3.2 kb; DHS2 includes the transcription initiation site; DHS3, +0.8 kb; DHS4, +1.4 kb; DHS5, +1.7 kb; DHS6, +4.1 kb; the positions of DHS1-DHS6 in the Snrpn gene were calculated as an average of at least two independent experiments and/or different restriction enzymes and probes. The same DH sites mapped by different experiments, restriction enzymes, and/or blots generally localized within 200–300 bp of each other, a variation within the range expected by estimating positions derived from band sizes in Southern blots.

